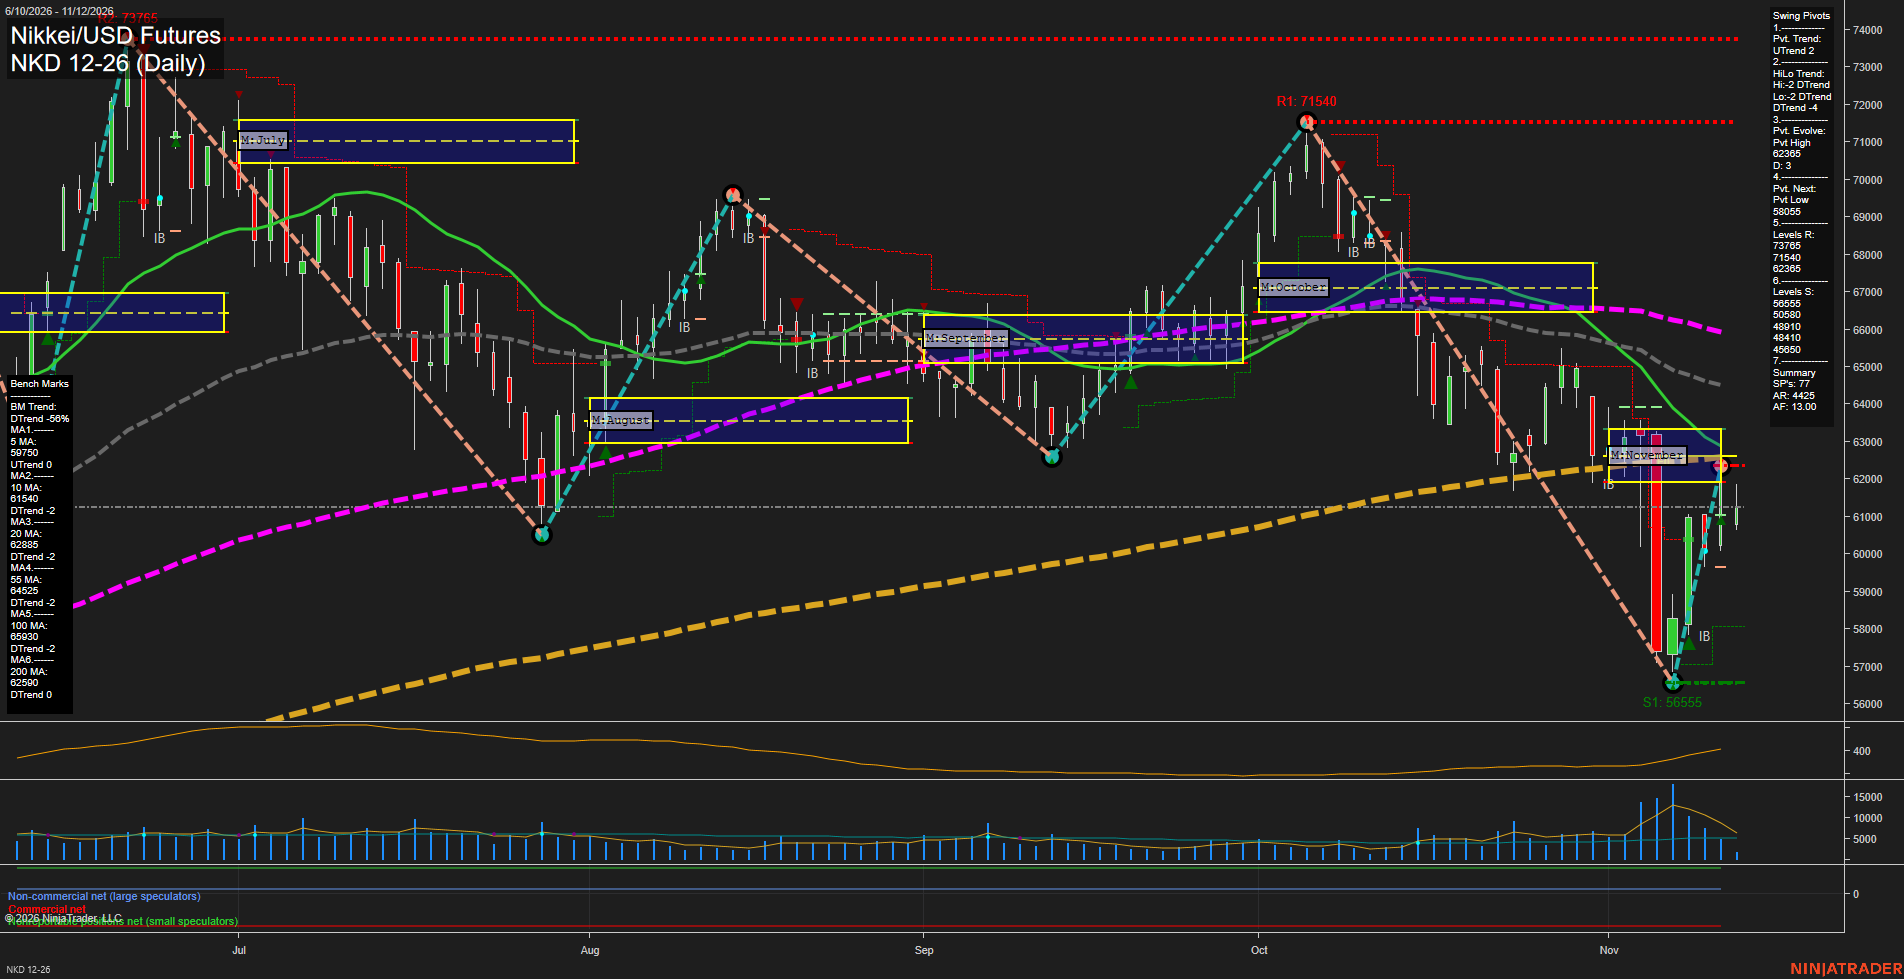
NKD Nikkei/USD Futures Daily Chart Analysis: 2026-Nov-12 15:10 CT
Price Action
- Last: Approximately 61250,
- Bars: Small,
- Mom: Momentum slow.
WSFG Weekly
- Short-Term
- WSFG Current: 63%
- F0%/NTZ' Bias: Price Above,
- WSFG Trend: Up.
MSFG Month Nov
- Intermediate-Term
- MSFG Current: -17%
- F0%/NTZ' Bias: Price Below,
- MSFG Trend: Down.
YSFG Year 2026
- Long-Term
- YSFG Current: 127%
- F0%/NTZ' Bias: Price Above,
- YSFG Trend: Up.
Swing Pivots
- (Short-Term) 1. Pvt. Trend: UTrend,
- (Intermediate-Term) 2. HiLo Trend: DTrend,
- 3. Pvt. Evolve: Pvt high 62365,
- 4. Pvt. Next: Pvt low 58055,
- 5. Levels R: 73765, 71540, 62365,
- 6. Levels S: 56555, 50580, 48910, 48410, 45650.
Daily Benchmarks
- (Short-Term) 5 Day: 59750 Up Trend,
- (Short-Term) 10 Day: 61540 Down Trend,
- (Intermediate-Term) 20 Day: 62885 Down Trend,
- (Intermediate-Term) 55 Day: 64525 Down Trend,
- (Long-Term) 100 Day: 65930 Down Trend,
- (Long-Term) 200 Day: 62590 Down Trend.
Additional Metrics
Recent Trade Signals
- 04 Nov 2026: Long NKD 12-26 @ 63190 Signals.USAR-WSFG
Overall Rating
- Short-Term: Bullish,
- Intermediate-Term: Bearish,
- Long-Term: Bearish.
Key Insights Summary
The swing-trading picture is a short-term recovery within a broader downtrend. The rebound from 56555 established an evolving pivot high at 62365, but smaller recent candles indicate slowing momentum. Weekly grid strength, the upward pivot trend and the rising five-day benchmark support the short-term bullish rating. However, price remains below the declining ten-day benchmark and November NTZ, while lower intermediate-term pivots and declining 20-day and 55-day benchmarks characterize the recovery as countertrend. Resistance is concentrated around 62365–62885, encompassing the rebound high and 200-day and 20-day benchmarks. The next opposite-pivot threshold is 58055, above established support at 56555. Long-term conditions remain technically bearish despite the positive yearly grid reading, with price below both declining long-term benchmarks. The supplied November 4 long signal is currently below its entry price. Volume expanded during the sharp November selloff and initial rebound, then moderated as the recovery stalled. The chart alone does not establish a news or seasonal catalyst.
Chart Analysis ATS AI Generated: 2026-11-12 15:10 for Informational use only, not trading advice. Terms and Risk Disclosure Copyright © 2026. Algo Trading Systems LLC.