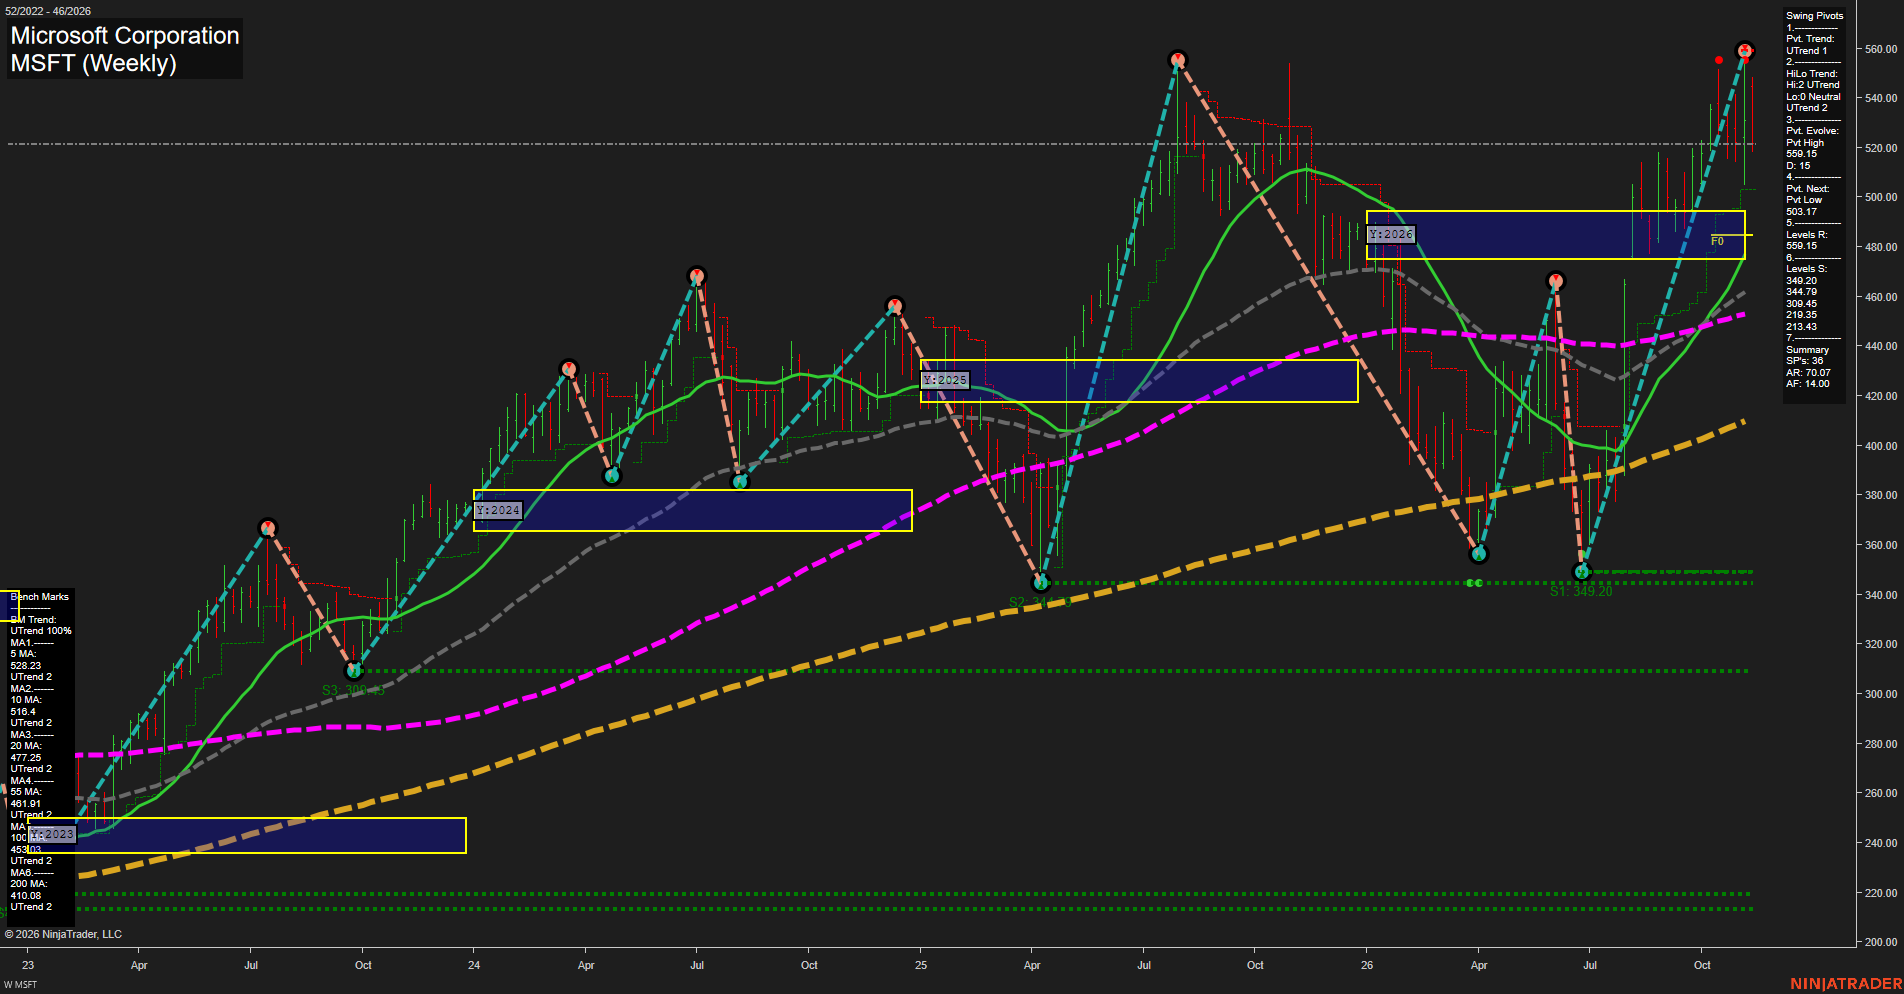
MSFT Microsoft Corporation Weekly Chart Analysis: 2026-Nov-12 15:09 CT
Price Action
- Last: Approximately 521.00; exact black price marker not visible,
- Bars: Large,
- Mom: Momentum slow.
WSFG Weekly
- Short-Term
- WSFG Current: NA%
- F0%/NTZ' Bias: Price Neutral,
- WSFG Trend: Neutral.
MSFG Month Nov
- Intermediate-Term
- MSFG Current: NA%
- F0%/NTZ' Bias: Price Neutral,
- MSFG Trend: Neutral.
YSFG Year 2026
- Long-Term
- YSFG Current: NA%
- F0%/NTZ' Bias: Price Above NTZ,
- YSFG Trend: Bullish.
Swing Pivots
- (Short-Term) 1. Pvt. Trend: UTrend,
- (Intermediate-Term) 2. HiLo Trend: UTrend,
- 3. Pvt. Evolve: Pvt high 559.15,
- 4. Pvt. Next: Pvt low 503.17,
- 5. Levels R: 559.15,
- 6. Levels S: 349.20, 344.79, 309.45, 219.35, 213.43.
Weekly Benchmarks
- (Short-Term) 5 Day: 528.23 Up Trend,
- (Short-Term) 10 Day: 516.4 Up Trend,
- (Intermediate-Term) 20 Day: 477.25 Up Trend,
- (Intermediate-Term) 55 Day: 461.91 Up Trend,
- (Long-Term) 100 Day: 453.03 Up Trend,
- (Long-Term) 200 Day: 410.08 Up Trend.
Overall Rating
- Short-Term: Bullish,
- Intermediate-Term: Bullish,
- Long-Term: Bullish.
Key Insights Summary
From a futures swing trader’s perspective, this equity chart shows a bullish trend with a short-term countertrend pullback, rather than an established bearish reversal. The recovery from 349.20 has reached an evolving pivot high of 559.15, followed by rejection toward approximately 521. Price is below the rising five-period benchmark but remains above the ten-period benchmark and all slower averages, indicating cooling momentum within a broader advance. The pivot summary retains an upward trend, with 503.17 identified as the next opposite-pivot reversal threshold, not a confirmed swing-low support. The yearly neutral zone near 475–495 lies below price, supporting a bullish long-term grid interpretation. Large weekly ranges and upper-price rejection show substantial two-way volatility around the prior peak. Weekly and monthly grids and the specified recent trade signals are not visible; their neutral entries represent unavailable confirmation rather than demonstrated consolidation. No news or seasonal catalyst can be established from this image, and futures-specific volume, basis, and positioning are not shown.
Chart Analysis ATS AI Generated: 2026-11-12 15:09 for Informational use only, not trading advice. Terms and Risk Disclosure Copyright © 2026. Algo Trading Systems LLC.