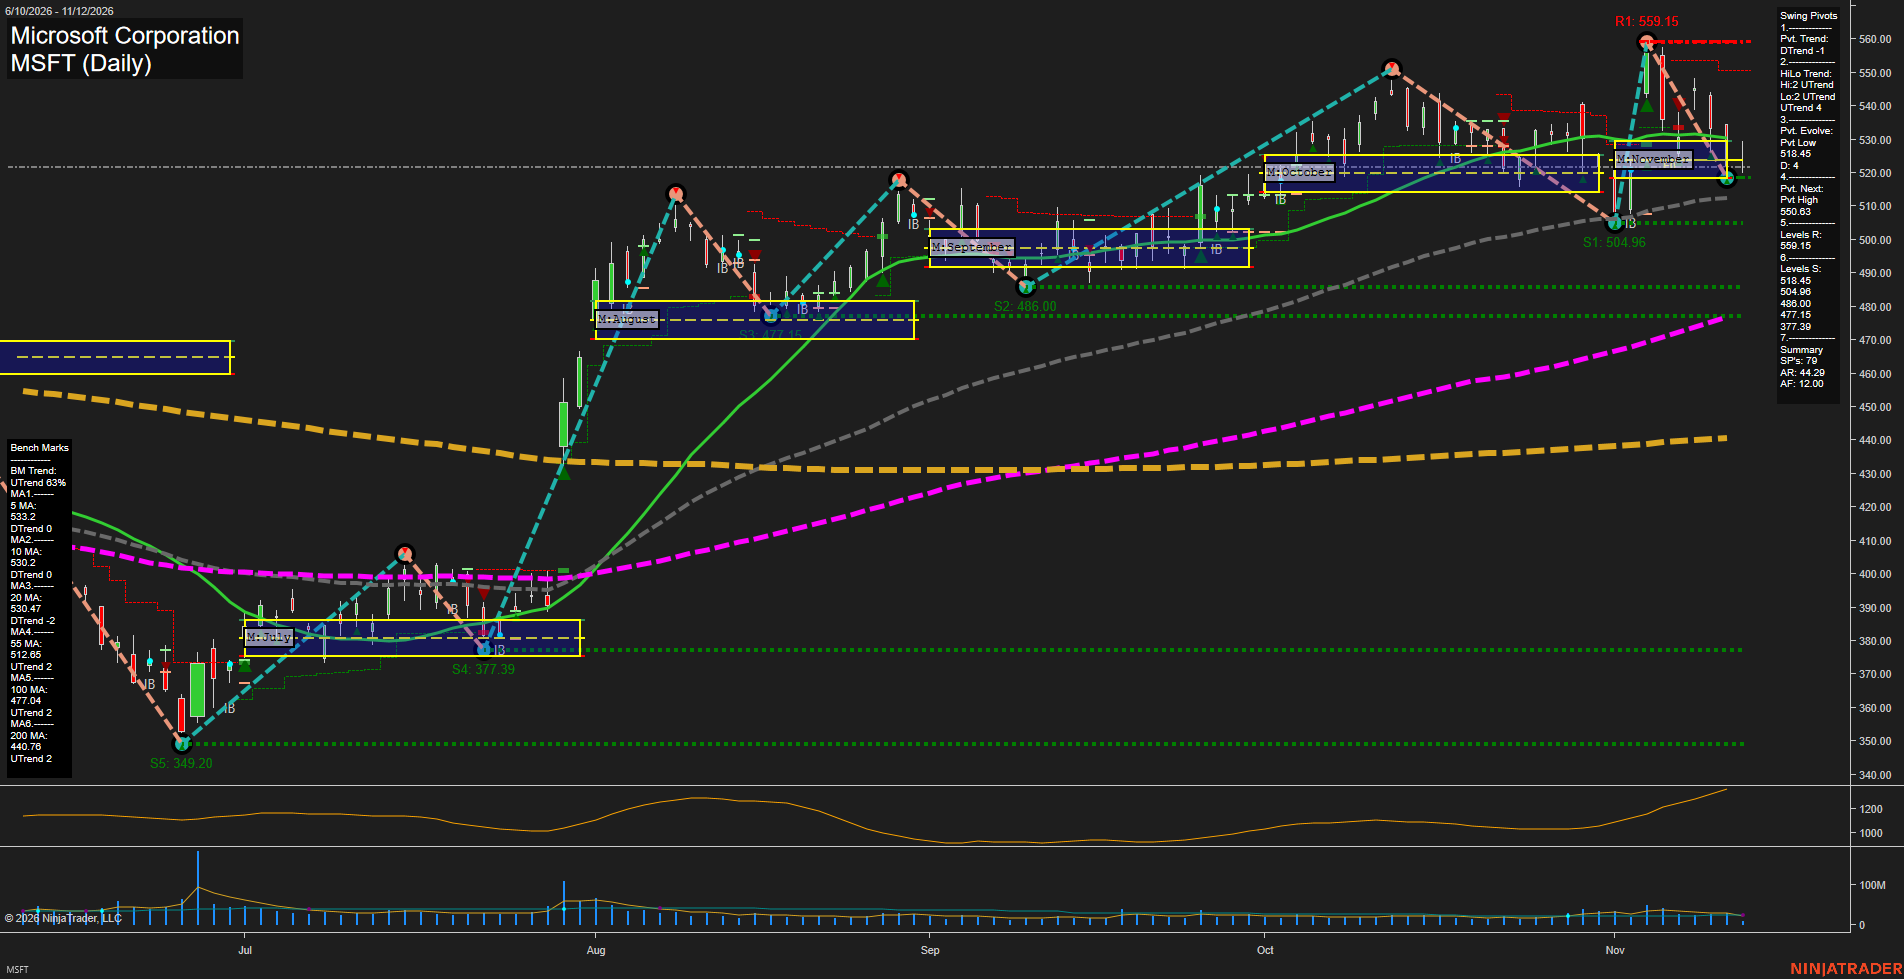
MSFT Microsoft Corporation Daily Chart Analysis: 2026-Nov-12 15:09 CT
Price Action
- Last: Approximately 522; exact black price marker not visible,
- Bars: Large,
- Mom: Fast bearish momentum.
WSFG Weekly
- Short-Term
- WSFG Current: NA%
- F0%/NTZ' Bias: Price Neutral,
- WSFG Trend: Neutral.
MSFG Month Nov
- Intermediate-Term
- MSFG Current: NA%
- F0%/NTZ' Bias: Price Neutral,
- MSFG Trend: Neutral.
YSFG Year 2026
- Long-Term
- YSFG Current: NA%
- F0%/NTZ' Bias: Price Neutral,
- YSFG Trend: Neutral.
Swing Pivots
- (Short-Term) 1. Pvt. Trend: DTrend,
- (Intermediate-Term) 2. HiLo Trend: UTrend,
- 3. Pvt. Evolve: Pvt low 518.45,
- 4. Pvt. Next: Pvt high 550.63,
- 5. Levels R: 559.15,
- 6. Levels S: 518.45, 504.96, 486.00, 477.15, 377.39.
Daily Benchmarks
- (Short-Term) 5 Day: 533.2 Down Trend,
- (Short-Term) 10 Day: 530.2 Down Trend,
- (Intermediate-Term) 20 Day: 530.47 Down Trend,
- (Intermediate-Term) 55 Day: 512.65 Up Trend,
- (Long-Term) 100 Day: 477.04 Up Trend,
- (Long-Term) 200 Day: 440.76 Up Trend.
Additional Metrics
- ATR: 791,
- VOLMA: 26357793.
Overall Rating
- Short-Term: Bearish,
- Intermediate-Term: Bullish,
- Long-Term: Bullish.
Key Insights Summary
From a futures swing-trading perspective, this equity chart shows a fast countertrend downswing within a broader rising structure, rather than a confirmed major-trend reversal. The retreat from 559.15 has carried price beneath the falling 5-, 10- and 20-day benchmarks and back into November’s monthly balance area. Short-term control is bearish, while the higher-high/higher-low pivot summary and rising 55-day benchmark preserve a bullish intermediate-term majority. The evolving 518.45 low and 504.96 support define the nearby structural downside references; 530.20–533.20 marks overhead benchmark congestion. The rising 100- and 200-day averages retain the bullish long-term backdrop. Recent wide ranges indicate an expanded volatility regime. The specified trade-signal series, news catalysts and seasonal evidence are not readable from this image, so no conclusions about those inputs are included. ATR and VOLMA above reproduce the supplied values; the image does not independently confirm their exact readings.
Chart Analysis ATS AI Generated: 2026-11-12 15:09 for Informational use only, not trading advice. Terms and Risk Disclosure Copyright © 2026. Algo Trading Systems LLC.