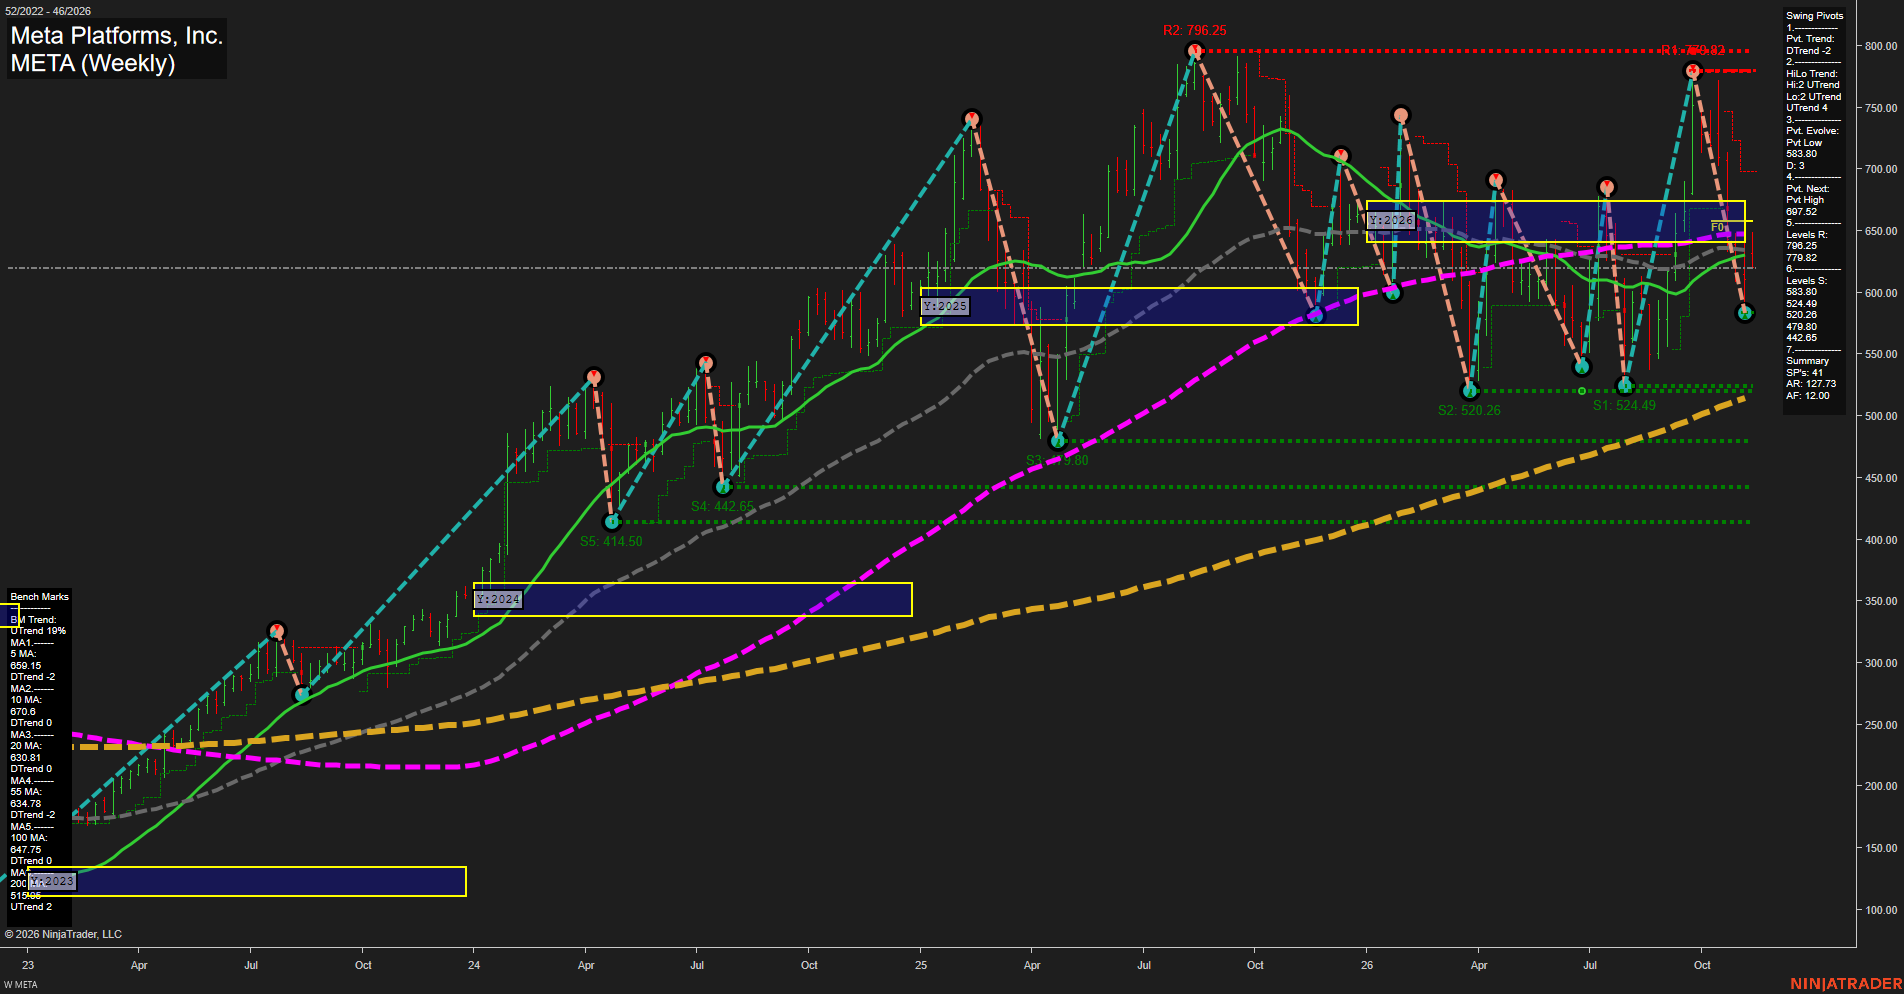
META Meta Platforms; Inc. Weekly Chart Analysis: 2026-Nov-12 15:08 CT
Price Action
- Last: Approximately 620; exact black price marker not legible,
- Bars: Large,
- Mom: Fast downswing momentum, with a developing rebound.
WSFG Weekly
- Short-Term
- WSFG Current: NA%
- F0%/NTZ' Bias: Price Neutral,
- WSFG Trend: Neutral.
MSFG Month Nov
- Intermediate-Term
- MSFG Current: NA%
- F0%/NTZ' Bias: Price Neutral,
- MSFG Trend: Neutral.
YSFG Year 2026
- Long-Term
- YSFG Current: NA%
- F0%/NTZ' Bias: Price Below NTZ,
- YSFG Trend: Bearish.
Swing Pivots
- (Short-Term) 1. Pvt. Trend: DTrend,
- (Intermediate-Term) 2. HiLo Trend: UTrend,
- 3. Pvt. Evolve: Pvt low 583.80,
- 4. Pvt. Next: Pvt high 697.52,
- 5. Levels R: 796.25, 779.82,
- 6. Levels S: 583.80, 524.49, 520.26, 479.80, 442.65.
Weekly Benchmarks
- (Short-Term) 5 Day: 659.15 Down Trend,
- (Short-Term) 10 Day: 670.60 Down Trend,
- (Intermediate-Term) 20 Day: 630.81 Down Trend,
- (Intermediate-Term) 55 Day: 634.78 Down Trend,
- (Long-Term) 100 Day: 647.75 Down Trend,
- (Long-Term) 200 Day: Approximately 515.35 Up Trend.
Overall Rating
- Short-Term: Bearish,
- Intermediate-Term: Bearish,
- Long-Term: Neutral.
Key Insights Summary
From a futures swing trader's perspective, this equity chart shows a fast corrective downswing within a broader, increasingly choppy advance. The decline from 779.82 to the evolving 583.80 pivot represents approximately 25%, followed by a rebound toward 620. Price remains below the 630.81–670.60 benchmark cluster and the 2026 yearly neutral zone, indicating that the rebound has not yet repaired the shorter-term technical damage. Intermediate pivot structure remains upward, with the latest low above the earlier 524.49 and 520.26 lows, despite downward benchmark trends. The rising 200-period benchmark contrasts with the declining 100-period benchmark, supporting a mixed long-term assessment. Weekly and monthly grids and the named recent trade signals are not visible; their neutral entries reflect unavailable confirmation rather than verified neutral signals. News and seasonal effects cannot be established from this chart alone.
Chart Analysis ATS AI Generated: 2026-11-12 15:09 for Informational use only, not trading advice. Terms and Risk Disclosure Copyright © 2026. Algo Trading Systems LLC.