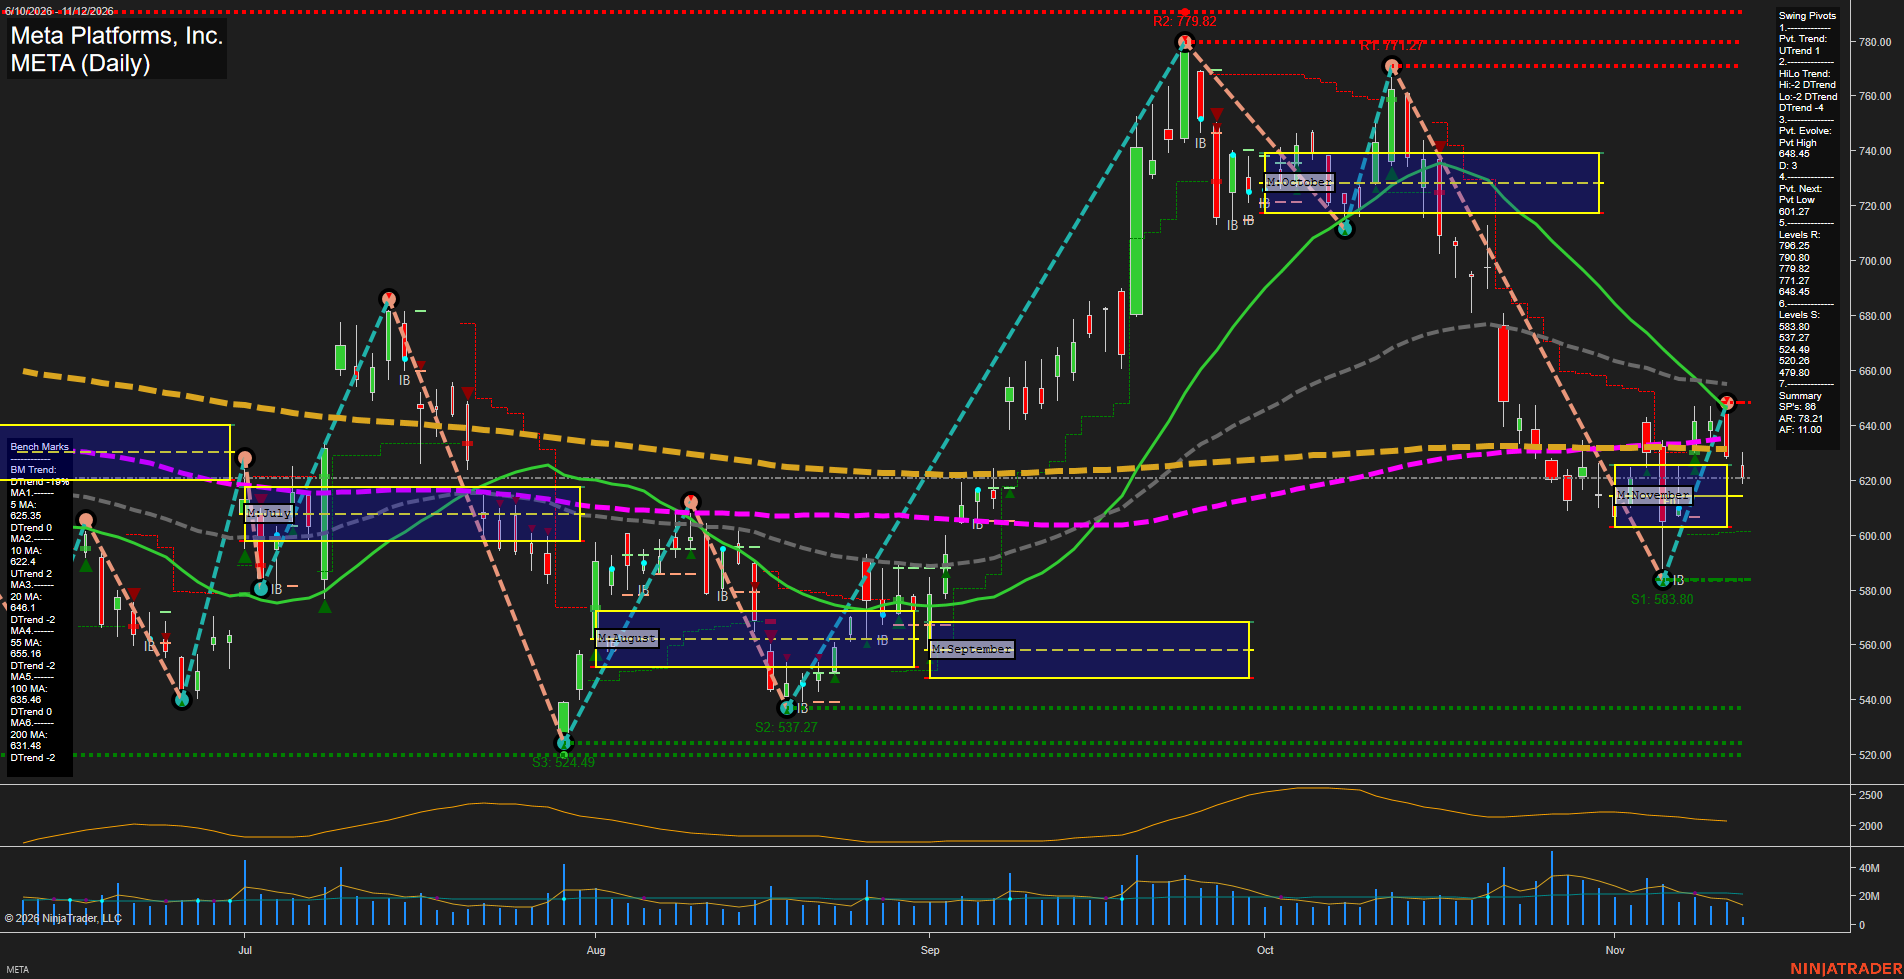
META Meta Platforms; Inc. Daily Chart Analysis: 2026-Nov-12 15:08 CT
Price Action
- Last: Approximately 621; exact black price marker not visible,
- Bars: Small,
- Mom: Momentum slow.
WSFG Weekly
- Short-Term
- WSFG Current: NA%
- F0%/NTZ' Bias: Price Neutral,
- WSFG Trend: Neutral.
MSFG Month Nov
- Intermediate-Term
- MSFG Current: NA%
- F0%/NTZ' Bias: Price Neutral,
- MSFG Trend: Neutral.
YSFG Year 2026
- Long-Term
- YSFG Current: NA%
- F0%/NTZ' Bias: Price Neutral,
- YSFG Trend: Neutral.
Swing Pivots
- (Short-Term) 1. Pvt. Trend: UTrend,
- (Intermediate-Term) 2. HiLo Trend: DTrend,
- 3. Pvt. Evolve: Pvt high 648.45,
- 4. Pvt. Next: Pvt low 601.27,
- 5. Levels R: 796.25, 790.80, 779.82, 771.27, 648.45,
- 6. Levels S: 583.80, 537.27, 524.49, 520.26, 479.80.
Daily Benchmarks
- (Short-Term) 5 Day: 625.35 Down Trend,
- (Short-Term) 10 Day: 622.4 Up Trend,
- (Intermediate-Term) 20 Day: 646.1 Down Trend,
- (Intermediate-Term) 55 Day: 655.16 Down Trend,
- (Long-Term) 100 Day: 635.46 Down Trend,
- (Long-Term) 200 Day: 631.48 Down Trend.
Additional Metrics
- ATR: 2162,
- VOLMA: 26211336.
Overall Rating
- Short-Term: Neutral,
- Intermediate-Term: Bearish,
- Long-Term: Bearish.
Key Insights Summary
From a futures swing trader’s perspective, META shows a short-term countertrend recovery within a broader bearish structure. The rebound from 583.80 established an evolving pivot high at 648.45, but price has subsequently retreated into November’s neutral trading zone. Small recent candles, slower momentum and lighter volume suggest consolidation rather than a confirmed upside continuation. Short-term evidence is mixed, with the pivot uptrend and rising 10-day benchmark offset by the falling 5-day benchmark. The intermediate-term lower-high/lower-low structure remains bearish, reinforced by declining 20-day and 55-day benchmarks. Price also sits below the declining 100-day and 200-day benchmarks, leaving the longer-term backdrop bearish. The 631.48–655.16 region contains clustered overhead benchmarks and pivot resistance; 601.27 is the displayed next-pivot reversal threshold, distinct from established support at 583.80. Weekly and yearly grids and named strategy signals are not visible, so their direction cannot be independently verified. No news or seasonal catalyst can be established from this chart alone.
Chart Analysis ATS AI Generated: 2026-11-12 15:08 for Informational use only, not trading advice. Terms and Risk Disclosure Copyright © 2026. Algo Trading Systems LLC.