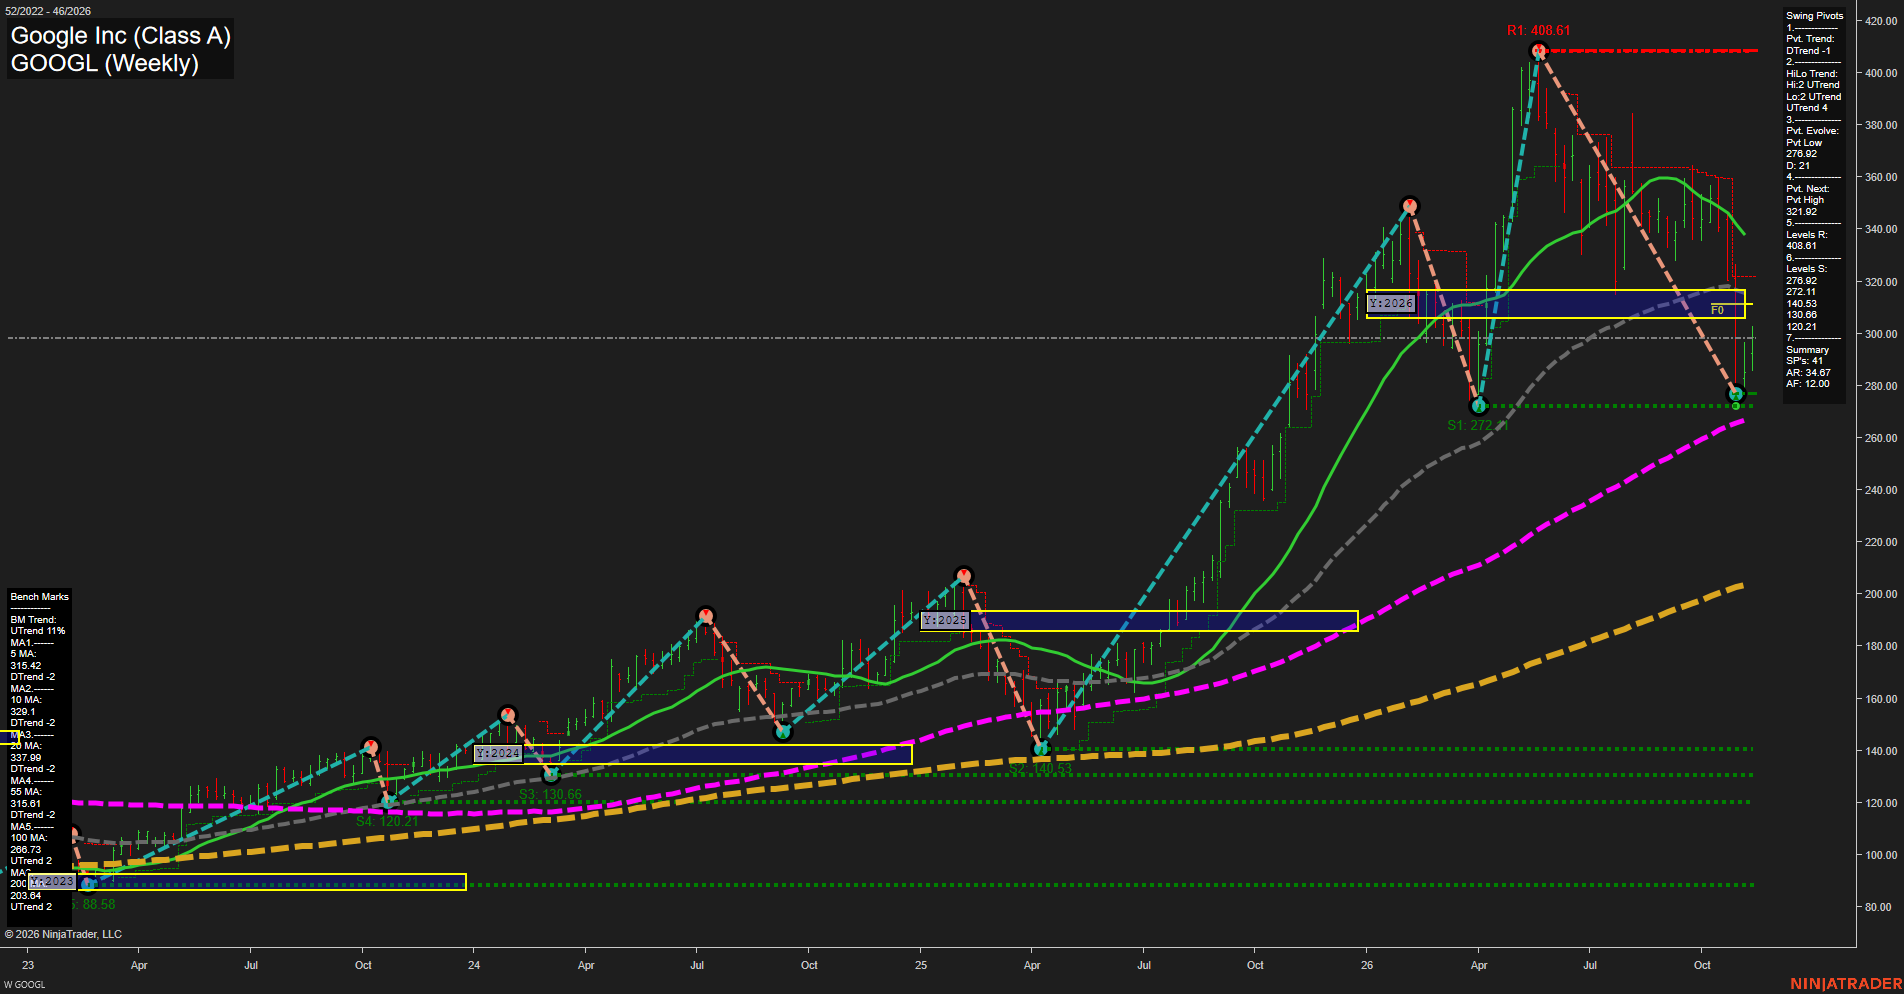
GOOGL Google Inc (Class A) Weekly Chart Analysis: 2026-Nov-12 15:08 CT
Price Action
- Last: Approximately 298; exact black price marker not visible,
- Bars: Large,
- Mom: Fast downside momentum followed by a rebound.
WSFG Weekly
- Short-Term
- WSFG Current: NA%
- F0%/NTZ' Bias: Price Neutral,
- WSFG Trend: Neutral.
MSFG Month Nov
- Intermediate-Term
- MSFG Current: NA%
- F0%/NTZ' Bias: Price Neutral,
- MSFG Trend: Neutral.
YSFG Year 2026
- Long-Term
- YSFG Current: NA%
- F0%/NTZ' Bias: Price below F0% and NTZ,
- YSFG Trend: Bearish.
Swing Pivots
- (Short-Term) 1. Pvt. Trend: DTrend,
- (Intermediate-Term) 2. HiLo Trend: UTrend,
- 3. Pvt. Evolve: Pvt low 276.92,
- 4. Pvt. Next: Pvt high 321.92,
- 5. Levels R: 408.61,
- 6. Levels S: 276.92, 272.11, 140.53, 130.66, 120.21.
Weekly Benchmarks
- (Short-Term) 5 Day: 315.42 Down Trend,
- (Short-Term) 10 Day: 329.1 Down Trend,
- (Intermediate-Term) 20 Day: 337.99 Down Trend,
- (Intermediate-Term) 55 Day: 315.61 Down Trend,
- (Long-Term) 100 Day: 266.73 Up Trend,
- (Long-Term) 200 Day: 203.64 Up Trend.
Overall Rating
- Short-Term: Bearish,
- Intermediate-Term: Bearish,
- Long-Term: Bullish.
Key Insights Summary
From a futures swing trader’s perspective, this equity chart shows a fast corrective downswing within a still-rising major trend. The decline from 408.61 to the evolving 276.92 low represents approximately 32% peak-to-trough compression, followed by a rebound toward 298. Price remains below all four shorter benchmarks and the yearly neutral zone near 306–317, so the rebound has not yet changed the short-term bearish structure. The 315–322 area combines benchmark resistance, the yearly grid, and the 321.92 opposite-pivot threshold. Intermediate structure is mixed: the summary retains a higher-high/higher-low UTrend, but falling 20- and 55-period benchmarks indicate corrective pressure. Support is concentrated at 276.92–272.11, above the rising 100-period benchmark at 266.73. Rising 100- and 200-period benchmarks preserve the long-term bullish classification despite the bearish yearly-grid position. Weekly and monthly grids and the named recent trade signals are not displayed; their direction cannot be verified. News and seasonal explanations cannot be established from this chart alone.
Chart Analysis ATS AI Generated: 2026-11-12 15:08 for Informational use only, not trading advice. Terms and Risk Disclosure Copyright © 2026. Algo Trading Systems LLC.