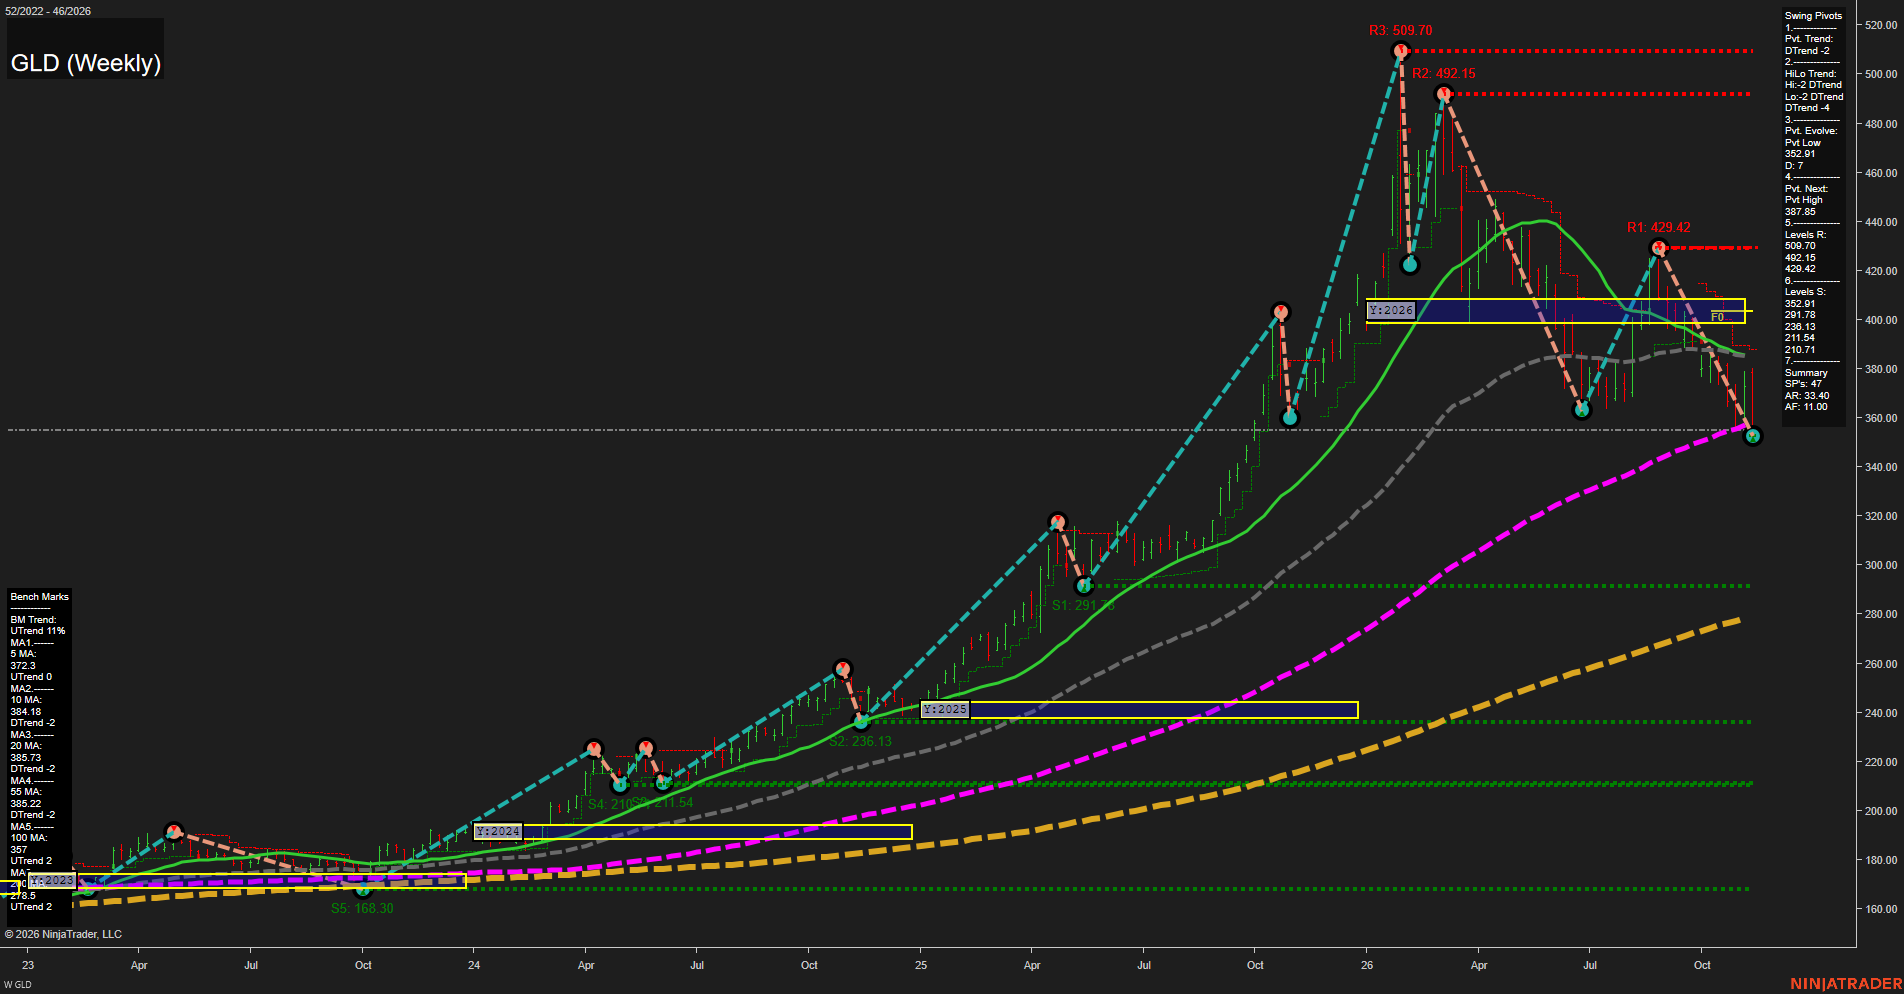
From a futures swing trader’s perspective, GLD shows a substantial bearish correction within a still-rising major trend. Successively lower swing highs at 509.70, 492.15 and 429.42, followed by an evolving low at 352.91, establish a declining swing structure. Large weekly ranges indicate elevated volatility and fast downside momentum. Price is below the declining 10-, 20- and 55-period benchmarks, with the latter three clustered around 384–386; the summary identifies 387.85 as the next opposite-pivot reversal threshold. The current downswing has reached slightly below the rising 100-period benchmark at 357.00, while the rising 200-period benchmark remains substantially lower at 278.50. This leaves long-term evidence mixed rather than uniformly bearish. The annual NTZ near 400–409 is overhead, reinforcing the loss of the annual balance area. Weekly and monthly grids and recent trade-signal readings are not displayed; their neutral template entries represent unavailable evidence, not confirmed neutral conditions. Benchmark labels follow the supplied summary, although this is a weekly chart. Exact last price, news catalysts and seasonal influences cannot be verified from the image; GLD levels are ETF prices, not gold futures contract levels.