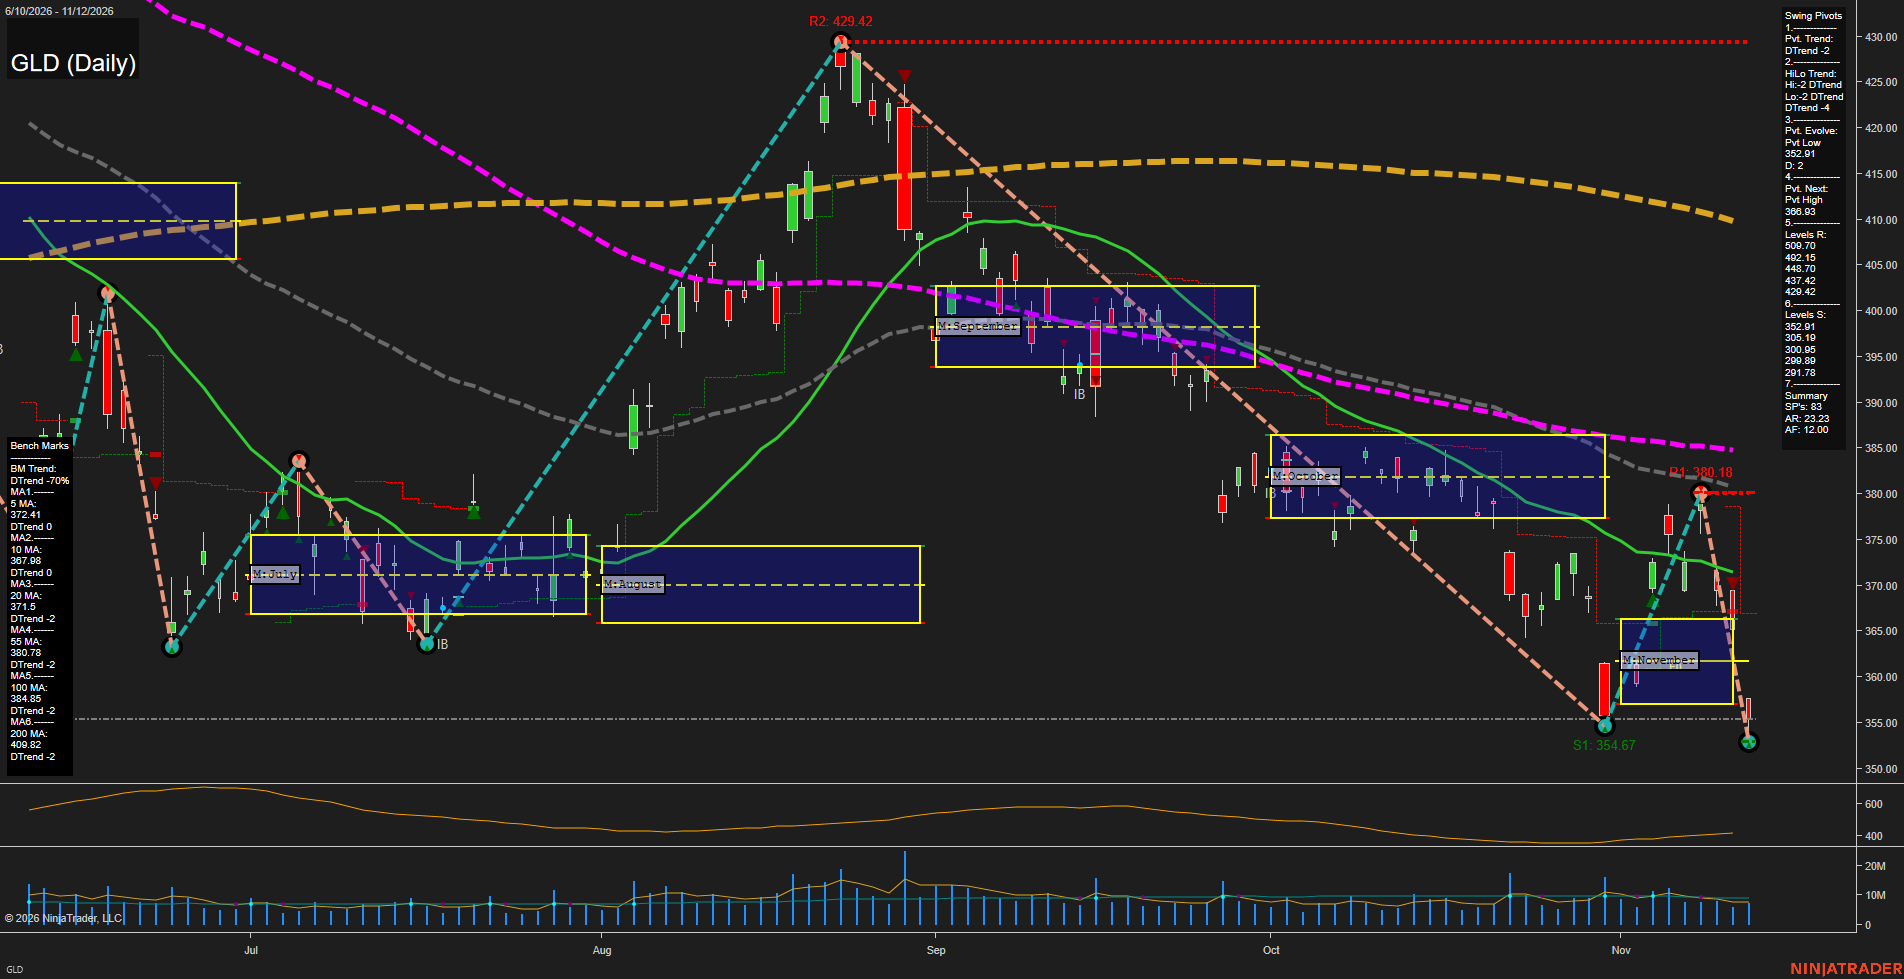
GLD SPDR Gold Shares Daily Chart Analysis: 2026-Nov-12 15:07 CT
Price Action
- Last: Approximately 355.50; exact black price marker not visible,
- Bars: Large,
- Mom: Momentum fast.
WSFG Weekly
- Short-Term
- WSFG Current: NA%
- F0%/NTZ' Bias: Price Neutral; weekly grid not shown,
- WSFG Trend: Neutral; unconfirmed.
MSFG Month Nov
- Intermediate-Term
- MSFG Current: NA%
- F0%/NTZ' Bias: Price Bearish; below F0% and NTZ Lower,
- MSFG Trend: Bearish.
YSFG Year 2026
- Long-Term
- YSFG Current: NA%
- F0%/NTZ' Bias: Price Neutral; yearly grid not shown,
- YSFG Trend: Neutral; unconfirmed.
Swing Pivots
- (Short-Term) 1. Pvt. Trend: DTrend,
- (Intermediate-Term) 2. HiLo Trend: DTrend,
- 3. Pvt. Evolve: Pvt low 352.91,
- 4. Pvt. Next: Pvt high 366.93,
- 5. Levels R: 509.70, 492.15, 448.70, 437.42, 429.42,
- 6. Levels S: 352.91, 305.19, 300.95, 299.89, 291.78.
Daily Benchmarks
- (Short-Term) 5 Day: 372.41 Down Trend,
- (Short-Term) 10 Day: 367.98 Down Trend,
- (Intermediate-Term) 20 Day: 371.15 Down Trend,
- (Intermediate-Term) 55 Day: 380.78 Down Trend,
- (Long-Term) 100 Day: 384.85 Down Trend,
- (Long-Term) 200 Day: 409.82 Down Trend.
Additional Metrics
- ATR: 159,
- VOLMA: 7207880.
Overall Rating
- Short-Term: Bearish,
- Intermediate-Term: Bearish,
- Long-Term: Bearish.
Key Insights Summary
From a futures swing trader’s perspective, GLD shows aligned downside trends rather than an isolated pullback. The rebound from 354.67 to 380.18 failed, followed by a sharp decline to an evolving 352.91 low, extending the lower-high/lower-low structure. Price is below all six declining benchmarks and below November’s monthly neutral zone, approximately 357–366, indicating renewed downside expansion after the rebound. The latest bar appears to recover modestly from its low, but this has not reversed the pivot downtrend; the summary identifies 366.93 as the next opposite-pivot reversal threshold. The nearby chart-marked 380.18 swing high is distinct from the resistance levels listed in the summary. Weekly and yearly grids and named trade-signal readings are not visible, so their directions cannot be verified. GLD is an ETF proxy for gold, not a futures contract; futures basis and contract-specific pricing are not represented. News and seasonal catalysts cannot be established from this chart. ATR and VOLMA above retain the supplied template values rather than independently verified panel readings.
Chart Analysis ATS AI Generated: 2026-11-12 15:08 for Informational use only, not trading advice. Terms and Risk Disclosure Copyright © 2026. Algo Trading Systems LLC.