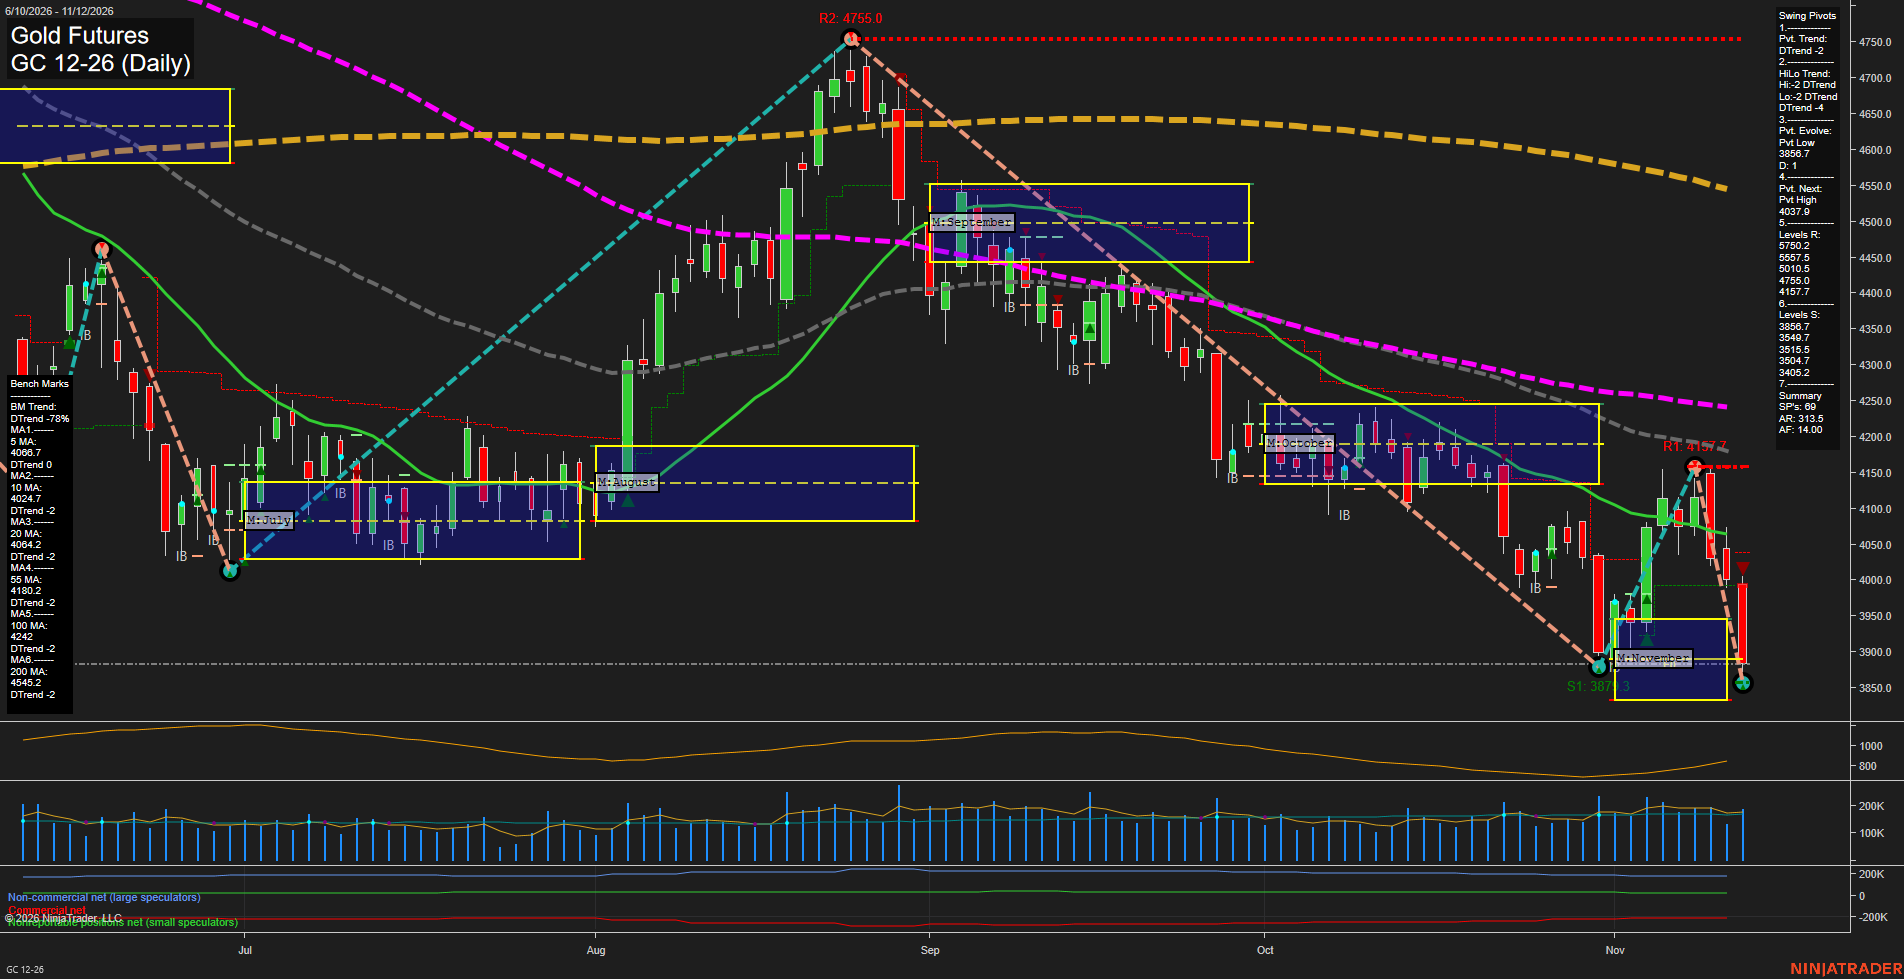
GC Gold Futures Daily Chart Analysis: 2026-Nov-12 15:07 CT
Price Action
- Last: Approximately 3883,
- Bars: Large,
- Mom: Momentum fast.
WSFG Weekly
- Short-Term
- WSFG Current: -93%
- F0%/NTZ' Bias: Price Below,
- WSFG Trend: Down.
MSFG Month Nov
- Intermediate-Term
- MSFG Current: -3%
- F0%/NTZ' Bias: Price Below,
- MSFG Trend: Down.
YSFG Year 2026
- Long-Term
- YSFG Current: -170%
- F0%/NTZ' Bias: Price Below,
- YSFG Trend: Down.
Swing Pivots
- (Short-Term) 1. Pvt. Trend: DTrend,
- (Intermediate-Term) 2. HiLo Trend: DTrend,
- 3. Pvt. Evolve: Pvt low 3856.7,
- 4. Pvt. Next: Pvt high 4037.9,
- 5. Levels R: 5750.2, 5557.5, 5010.5, 4755.0, 4157.7,
- 6. Levels S: 3856.7, 3549.7, 3515.5, 3504.7, 3405.2.
Daily Benchmarks
- (Short-Term) 5 Day: 4066.7 Down Trend,
- (Short-Term) 10 Day: 4024.7 Down Trend,
- (Intermediate-Term) 20 Day: 4084.2 Down Trend,
- (Intermediate-Term) 55 Day: 4180.2 Down Trend,
- (Long-Term) 100 Day: 4242.0 Down Trend,
- (Long-Term) 200 Day: 4545.2 Down Trend.
Additional Metrics
Recent Trade Signals
- 12 Nov 2026: Short GC 12-26 @ 3883.5 Signals.USAR.TR720
- 11 Nov 2026: Short GC 12-26 @ 4052.6 Signals.USAR-WSFG
- 10 Nov 2026: Short GC 12-26 @ 4030.1 Signals.USAR.TR120
Overall Rating
- Short-Term: Bearish,
- Intermediate-Term: Bearish,
- Long-Term: Bearish.
Key Insights Summary
From a futures swing-trading perspective, the rebound from 3877.3 to 4157.7 now reads as a countertrend rally followed by renewed selling. The evolving 3856.7 pivot low undercuts the prior low, reinforcing the lower-high/lower-low structure. Large bearish bars and price below all six declining benchmarks show downside momentum aligned across time horizons. Weekly, monthly and yearly grid trends reinforce that bearish assessment, as do the supplied short signals. Price is near the monthly grid center and recent lows, while 4157.7 remains the nearest listed overhead swing resistance. The 4037.9 next-pivot threshold is a structural reversal reference rather than an established resistance pivot. No intermediate-term MSFG trade signal or news catalyst is supplied, and this chart alone does not establish a seasonal explanation.
Chart Analysis ATS AI Generated: 2026-11-12 15:07 for Informational use only, not trading advice. Terms and Risk Disclosure Copyright © 2026. Algo Trading Systems LLC.