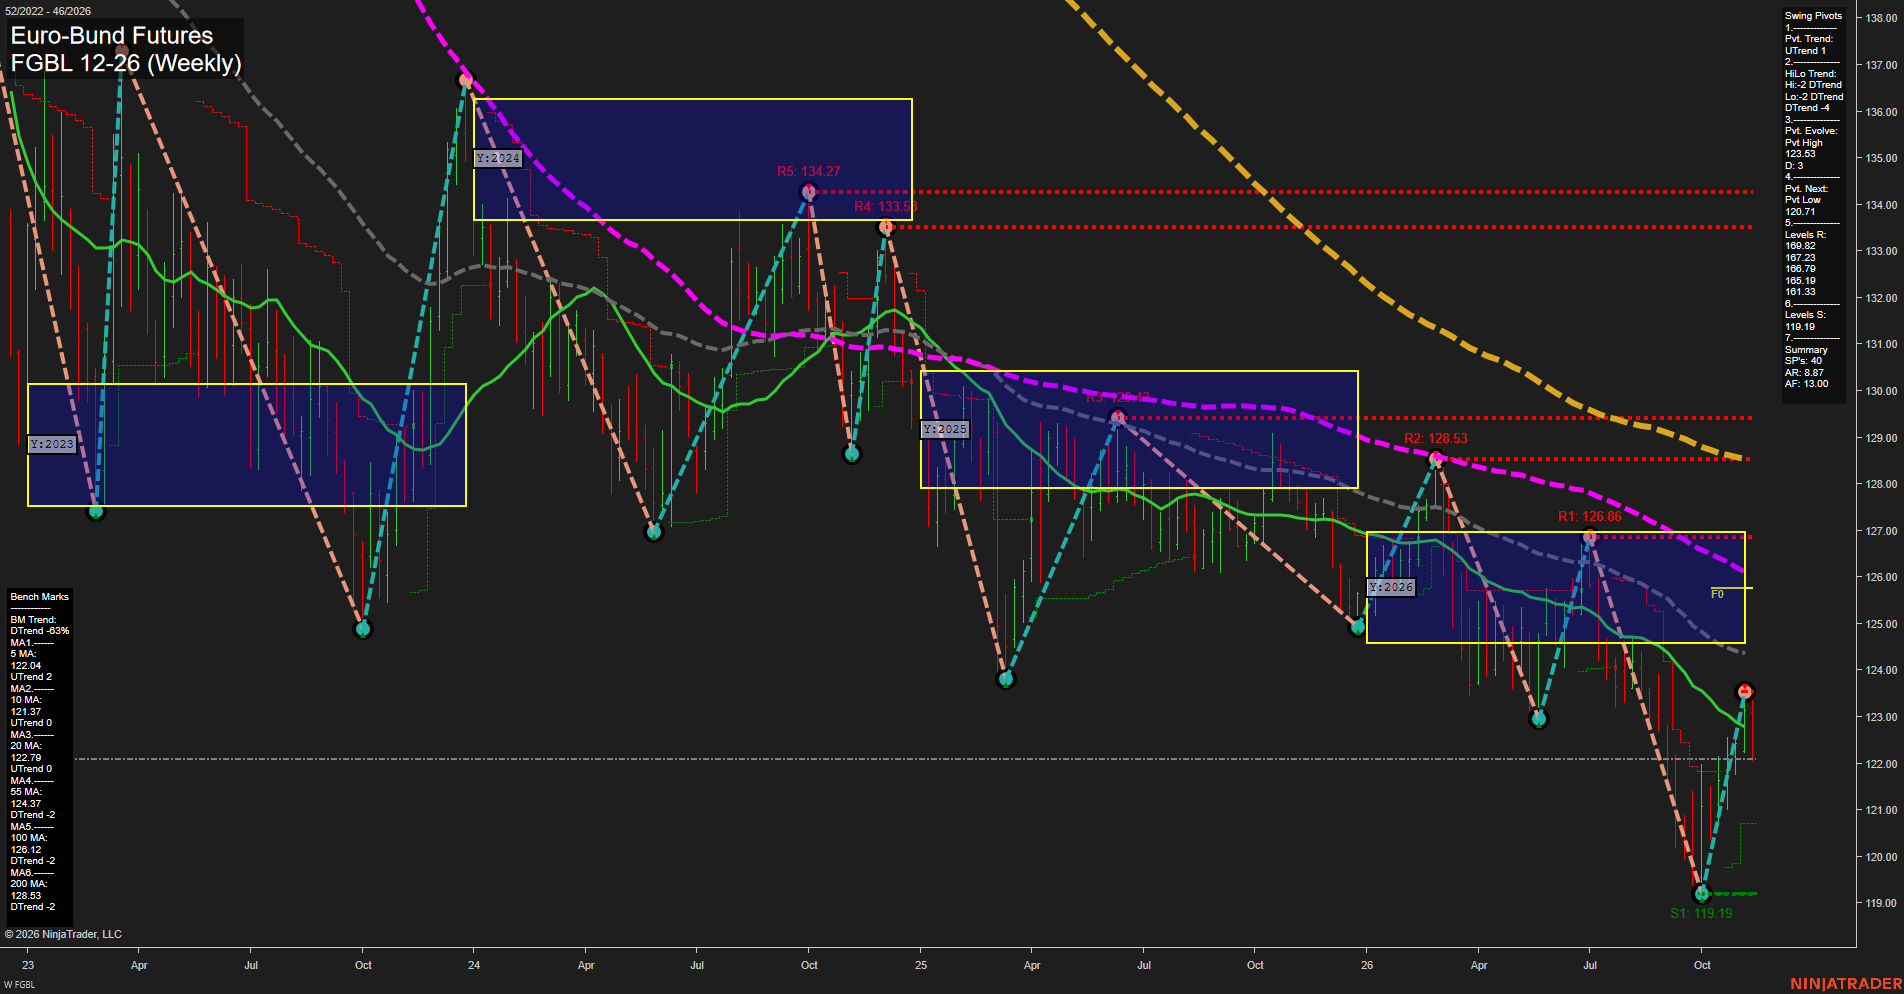
FGBL Euro-Bund Futures Weekly Chart Analysis: 2026-Nov-12 15:07 CT
Price Action
- Last: Approximately 122.12; exact black price marker not visible,
- Bars: Medium,
- Mom: Momentum average.
WSFG Weekly
- Short-Term
- WSFG Current: -79%
- F0%/NTZ' Bias: Price Below,
- WSFG Trend: Down.
MSFG Month Nov
- Intermediate-Term
- MSFG Current: -7%
- F0%/NTZ' Bias: Price Below,
- MSFG Trend: Down.
YSFG Year 2026
- Long-Term
- YSFG Current: -31%
- F0%/NTZ' Bias: Price Below,
- YSFG Trend: Down.
Swing Pivots
- (Short-Term) 1. Pvt. Trend: UTrend,
- (Intermediate-Term) 2. HiLo Trend: DTrend,
- 3. Pvt. Evolve: Pvt high 123.53,
- 4. Pvt. Next: Pvt low 120.71,
- 5. Levels R: 169.82, 167.23, 166.79, 165.19, 161.33,
- 6. Levels S: 119.19.
Weekly Benchmarks
- (Short-Term) 5 Day: 122.04 Up Trend,
- (Short-Term) 10 Day: 121.37 Up Trend,
- (Intermediate-Term) 20 Day: 122.79 Up Trend,
- (Intermediate-Term) 55 Day: 124.37 Down Trend,
- (Long-Term) 100 Day: 126.12 Down Trend,
- (Long-Term) 200 Day: 128.53 Down Trend.
Recent Trade Signals
- 10 Nov 2026: Short FGBL 12-26 @ 122.68 Signals.USAR.TR120
- 09 Nov 2026: Short FGBL 12-26 @ 122.93 Signals.USAR-WSFG
- 04 Nov 2026: Long FGBL 12-26 @ 122.57 Signals.USAR-MSFG
Overall Rating
- Short-Term: Bearish,
- Intermediate-Term: Bearish,
- Long-Term: Bearish.
Key Insights Summary
The rebound from 119.19 to an evolving pivot high of 123.53 represents a countertrend recovery within the broader lower-high/lower-low structure. Rising 5- and 10-period benchmarks and the upward short-term pivot trend show improving near-term conditions, but the latest price has retreated below the 20-period benchmark. Both recent short-term signals and all three session grids remain bearish, outweighing the rebound evidence. The declining 55-, 100- and 200-period benchmarks reinforce the broader downtrend, with price below the yearly neutral zone. The swing-summary resistance values reported above differ from the visible chart resistance labels at 134.27, 133.53, 129.43, 128.53 and 126.86; these should be treated as distinct displayed readings rather than reconciled levels. No long-term TR720 signal, news evidence or seasonal evidence is supplied.
Chart Analysis ATS AI Generated: 2026-11-12 15:07 for Informational use only, not trading advice. Terms and Risk Disclosure Copyright © 2026. Algo Trading Systems LLC.