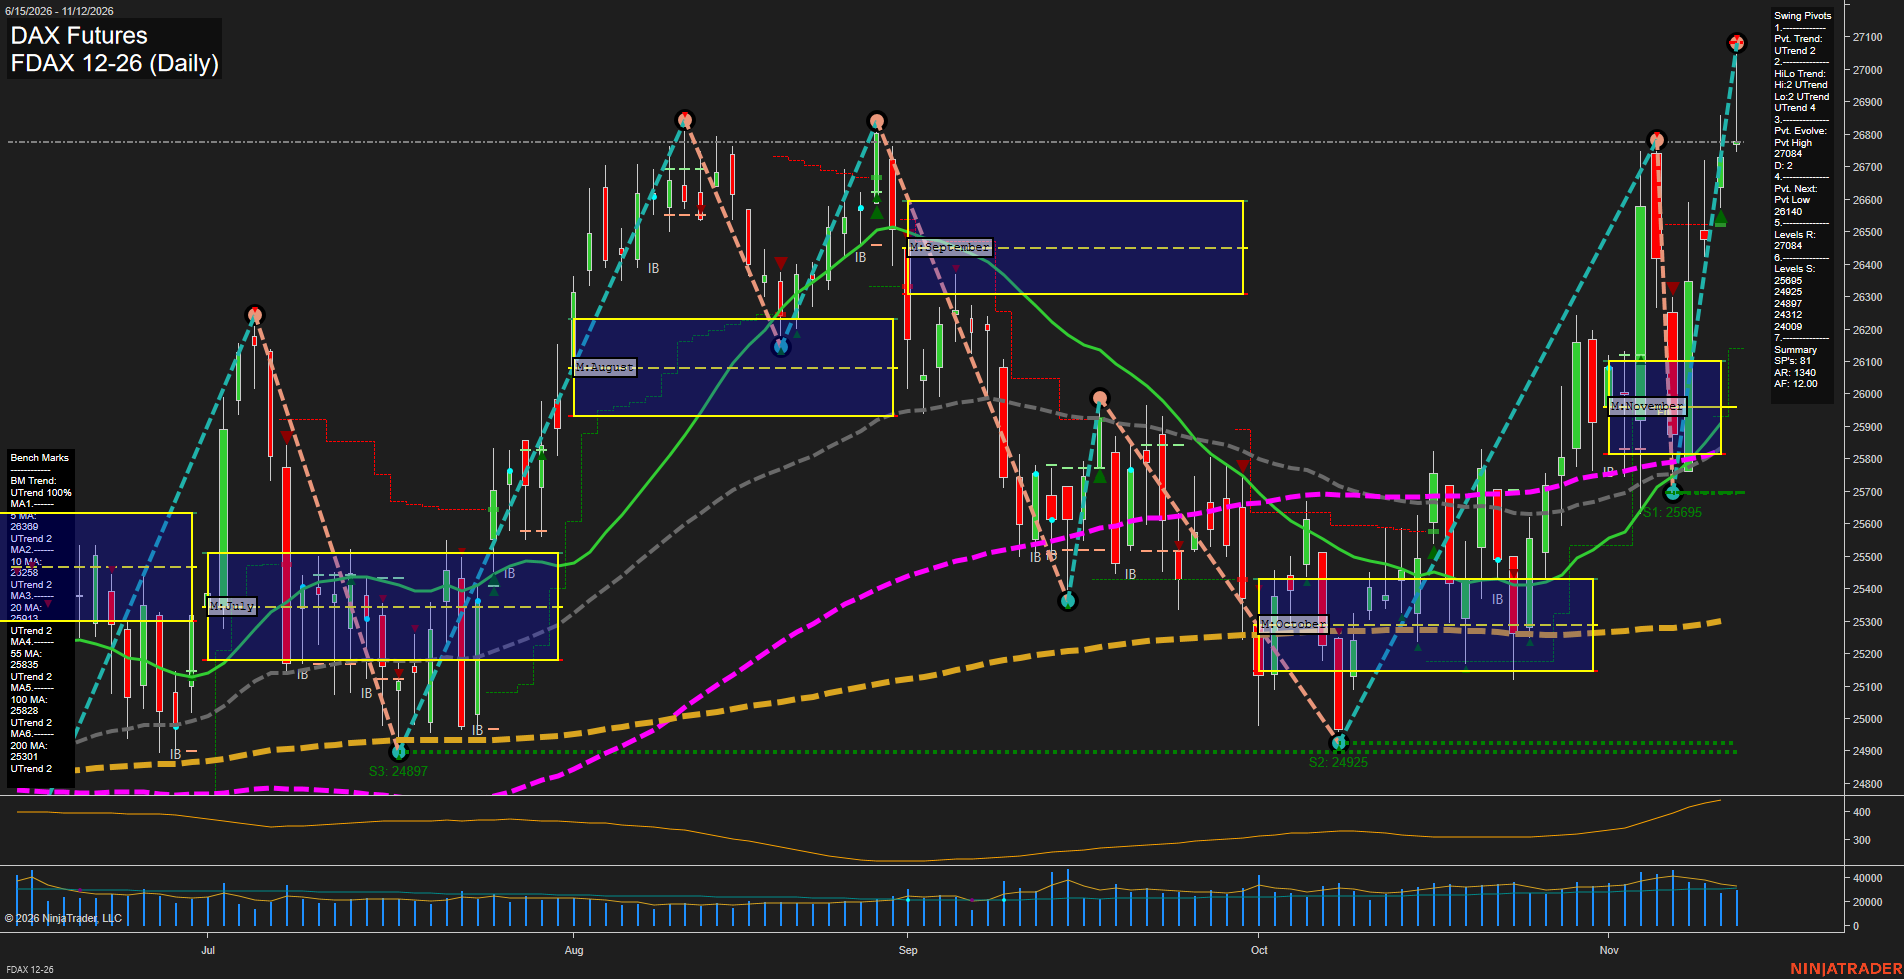
FDAX DAX Futures Daily Chart Analysis: 2026-Nov-12 15:06 CT
Price Action
- Last: Approximately 26780,
- Bars: Large,
- Mom: Momentum fast.
WSFG Weekly
- Short-Term
- WSFG Current: 119%
- F0%/NTZ' Bias: Price Above,
- WSFG Trend: Up.
MSFG Month Nov
- Intermediate-Term
- MSFG Current: 70%
- F0%/NTZ' Bias: Price Above,
- MSFG Trend: Up.
YSFG Year 2026
- Long-Term
- YSFG Current: 49%
- F0%/NTZ' Bias: Price Above,
- YSFG Trend: Up.
Swing Pivots
- (Short-Term) 1. Pvt. Trend: UTrend,
- (Intermediate-Term) 2. HiLo Trend: UTrend,
- 3. Pvt. Evolve: Pvt high 27084,
- 4. Pvt. Next: Pvt low 26140,
- 5. Levels R: 27084,
- 6. Levels S: 25695, 24925, 24897, 24312, 24009.
Daily Benchmarks
- (Short-Term) 5 Day: 26389 Up Trend,
- (Short-Term) 10 Day: 26258 Up Trend,
- (Intermediate-Term) 20 Day: 25913 Up Trend,
- (Intermediate-Term) 55 Day: 25835 Up Trend,
- (Long-Term) 100 Day: 25828 Up Trend,
- (Long-Term) 200 Day: 25301 Up Trend.
Additional Metrics
Recent Trade Signals
- 06 Nov 2026: Short FDAX 12-26 @ 25803 Signals.USAR-MSFG
- 06 Nov 2026: Short FDAX 12-26 @ 25803 Signals.USAR-WSFG
Overall Rating
- Short-Term: Bullish,
- Intermediate-Term: Bullish,
- Long-Term: Bullish.
Key Insights Summary
From a futures swing-trading perspective, the dominant structure is bullish across all three horizons. The recovery from October's 24925 low established a higher low at 25695 before extending to a fresh swing high of 27084. Price remains above all six rising benchmarks and above the weekly, monthly and yearly grid centers. Recent large daily ranges indicate a fast, volatile advance, although the latest small-bodied bar and retreat below 27084 show near-term hesitation rather than an uninterrupted breakout. The 26140 next-pivot threshold is distinct from confirmed swing support at 25695. The November 6 short signals conflict with the current upward trend alignment and describe earlier bearish conditions rather than fresh confirmation. Long-term benchmarks remain constructive, but the 55-day and 100-day averages are closely clustered, reflecting the preceding consolidation. News catalysts and seasonal effects cannot be verified from this chart alone.
Chart Analysis ATS AI Generated: 2026-11-12 15:06 for Informational use only, not trading advice. Terms and Risk Disclosure Copyright © 2026. Algo Trading Systems LLC.