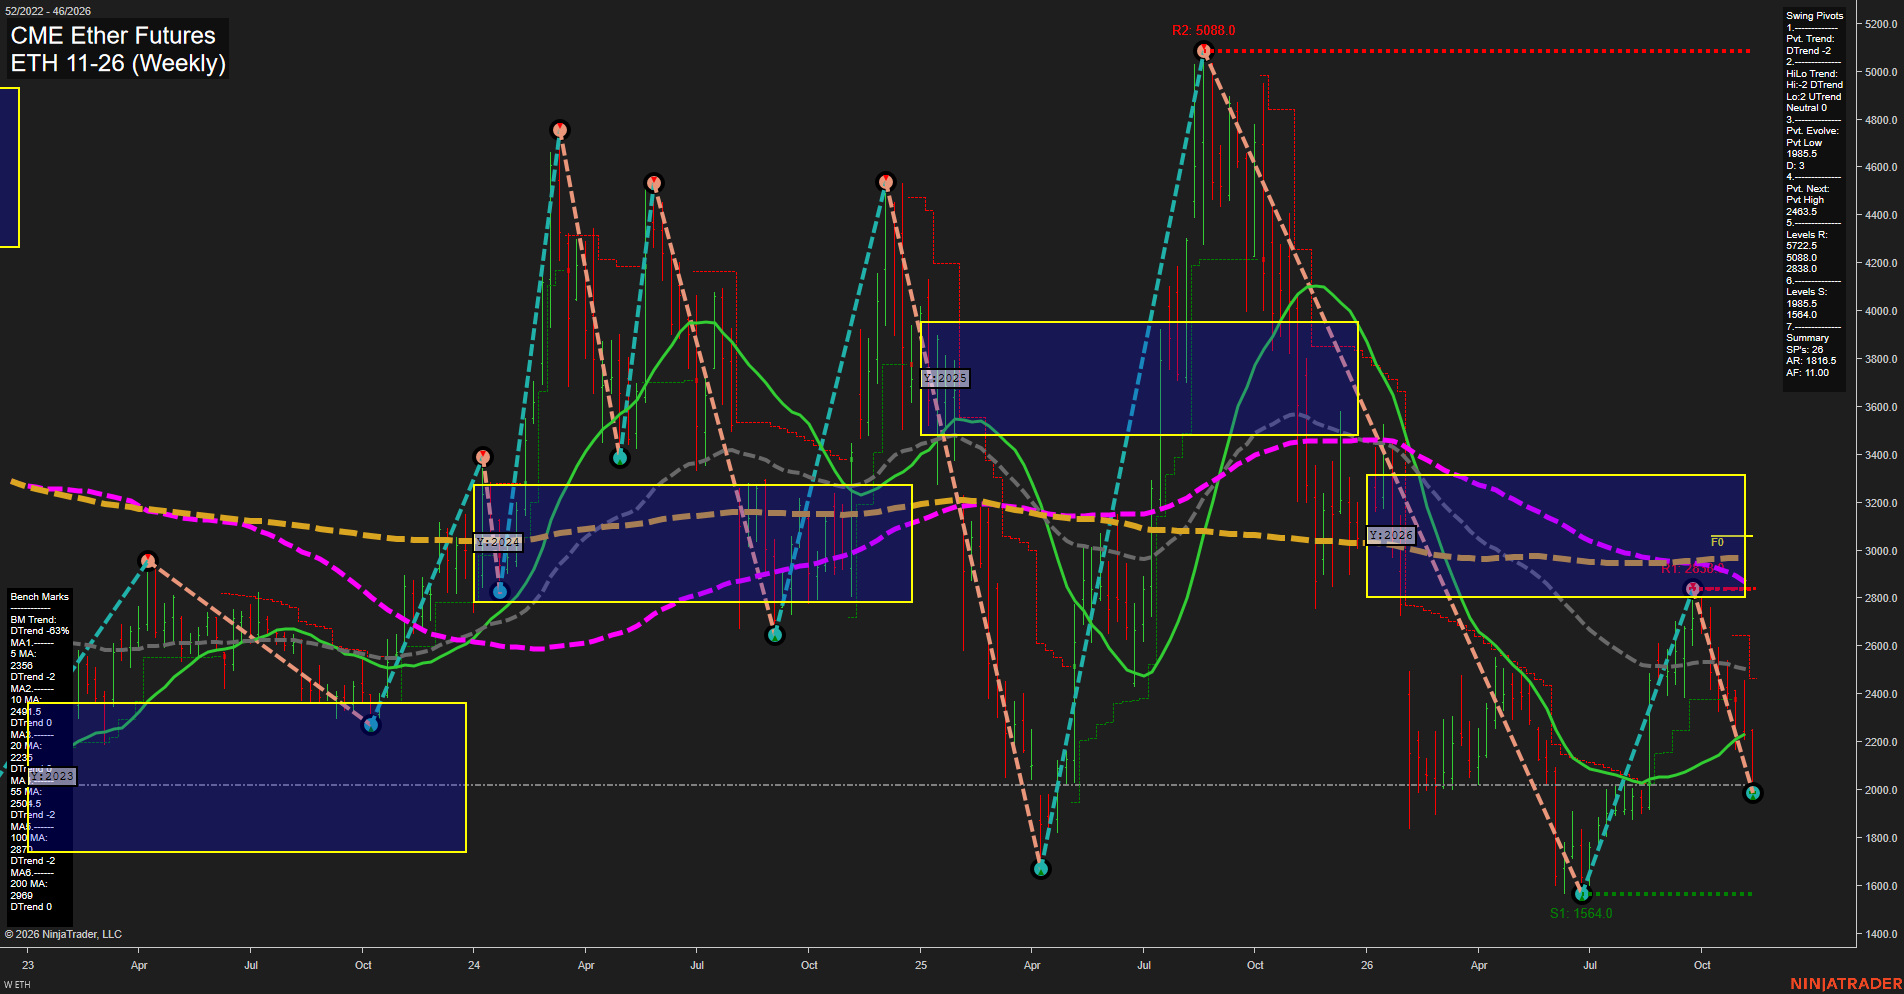
ETH CME Ether Futures Weekly Chart Analysis: 2026-Nov-12 15:06 CT
Price Action
- Last: Approximately 2020; exact black price marker not visible,
- Bars: Large,
- Mom: Momentum fast.
WSFG Weekly
- Short-Term
- WSFG Current: -101%
- F0%/NTZ' Bias: Price Below,
- WSFG Trend: Down.
MSFG Month Nov
- Intermediate-Term
- MSFG Current: -40%
- F0%/NTZ' Bias: Price Below,
- MSFG Trend: Down.
YSFG Year 2026
- Long-Term
- YSFG Current: -41%
- F0%/NTZ' Bias: Price Below,
- YSFG Trend: Down.
Swing Pivots
- (Short-Term) 1. Pvt. Trend: DTrend,
- (Intermediate-Term) 2. HiLo Trend: Neutral; highs DTrend, lows UTrend,
- 3. Pvt. Evolve: Pvt low 1985.5,
- 4. Pvt. Next: Pvt high 2463.5,
- 5. Levels R: 5722.5, 5088.0, 2838.0,
- 6. Levels S: 1985.5, 1564.0.
Weekly Benchmarks
- (Short-Term) 5 Day: 2356 Down Trend,
- (Short-Term) 10 Day: 2491.5 Neutral,
- (Intermediate-Term) 20 Day: Approximately 2233 Up Trend,
- (Intermediate-Term) 55 Day: 2506.5 Down Trend,
- (Long-Term) 100 Day: Approximately 2871 Down Trend,
- (Long-Term) 200 Day: 2960 Neutral.
Recent Trade Signals
- 06 Nov 2026: Short ETH 11-26 @ 2230 Signals.USAR-WSFG
Overall Rating
- Short-Term: Bearish,
- Intermediate-Term: Bearish,
- Long-Term: Bearish.
Key Insights Summary
The weekly structure shows a sharp selloff from the 2838 rebound high toward the evolving 1985.5 pivot low. Large weekly ranges and renewed downside momentum indicate that the rebound has reversed rather than developed into a sustained recovery. Short-term bearish alignment spans the pivot trend, weekly grid and reported short signal. Intermediate-term structure is less uniform: lower pivot highs coexist with higher pivot lows, while the rising 20-period benchmark contrasts with price trading beneath it. The 1985.5 support marks the immediate structural test, with 1564 the next listed support. Overhead resistance at 2838 lies near the lower boundary of the yearly neutral zone, reinforcing the significance of the failed rebound there. Price remains below all six benchmarks and the yearly neutral zone, supporting the broader bearish assessment. The image provides no evidence for attributing the move to news or seasonal factors.
Chart Analysis ATS AI Generated: 2026-11-12 15:06 for Informational use only, not trading advice. Terms and Risk Disclosure Copyright © 2026. Algo Trading Systems LLC.