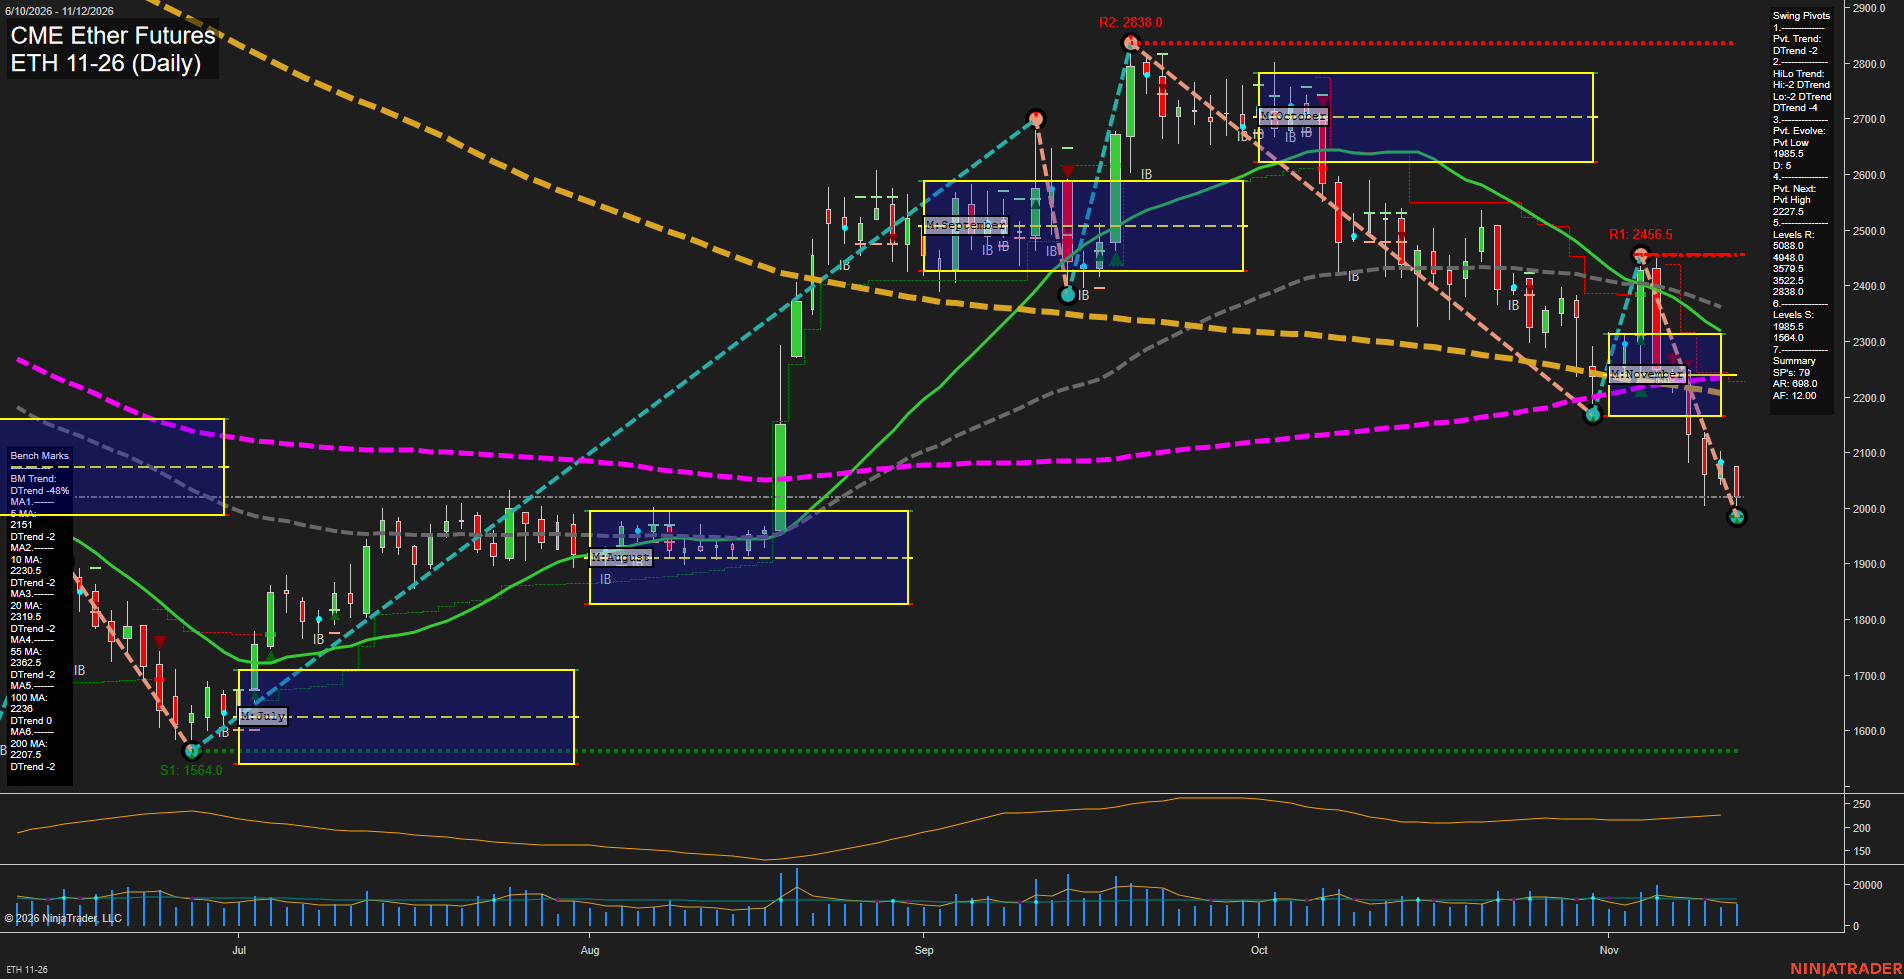
ETH CME Ether Futures Daily Chart Analysis: 2026-Nov-12 15:05 CT
Price Action
- Last: Approximately 2020,
- Bars: Large,
- Mom: Momentum fast.
WSFG Weekly
- Short-Term
- WSFG Current: -101%
- F0%/NTZ' Bias: Price Below,
- WSFG Trend: Down.
MSFG Month Nov
- Intermediate-Term
- MSFG Current: -40%
- F0%/NTZ' Bias: Price Below,
- MSFG Trend: Down.
YSFG Year 2026
- Long-Term
- YSFG Current: -41%
- F0%/NTZ' Bias: Price Below,
- YSFG Trend: Down.
Swing Pivots
- (Short-Term) 1. Pvt. Trend: DTrend,
- (Intermediate-Term) 2. HiLo Trend: DTrend,
- 3. Pvt. Evolve: Pvt low 1985.5,
- 4. Pvt. Next: Pvt high 2227.5,
- 5. Levels R: 5088.0, 4948.0, 3579.5, 3522.5, 2838.0,
- 6. Levels S: 1985.5, 1564.0.
Daily Benchmarks
- (Short-Term) 5 Day: 2151 Down Trend,
- (Short-Term) 10 Day: 2230.5 Down Trend,
- (Intermediate-Term) 20 Day: 2319.5 Down Trend,
- (Intermediate-Term) 55 Day: 2362.5 Down Trend,
- (Long-Term) 100 Day: 2236 Neutral Trend,
- (Long-Term) 200 Day: 2207.5 Down Trend.
Additional Metrics
Recent Trade Signals
- 06 Nov 2026: Short ETH 11-26 @ 2230 Signals.USAR-WSFG
Overall Rating
- Short-Term: Bearish,
- Intermediate-Term: Bearish,
- Long-Term: Bearish.
Key Insights Summary
From a futures swing trader’s perspective, the chart shows bearish trend continuation rather than an established recovery. The early-November rebound stalled at 2456.5, below the prior 2838.0 swing high, before price broke beneath the November NTZ and all six benchmark averages. Lower highs and lower lows reinforce the short- and intermediate-term downtrends, while the falling 200-day benchmark and negative yearly grid support the bearish longer-term assessment. The evolving 1985.5 pivot low marks the immediate support test; 1564.0 is the next support listed in the summary. The 2227.5 next-pivot threshold sits near the 10-day and 100-day benchmarks, forming an overhead technical cluster. Large declining bars indicate forceful downside momentum, although volume does not visibly establish a climactic washout. The chart alone does not establish a news catalyst or seasonal explanation.
Chart Analysis ATS AI Generated: 2026-11-12 15:06 for Informational use only, not trading advice. Terms and Risk Disclosure Copyright © 2026. Algo Trading Systems LLC.