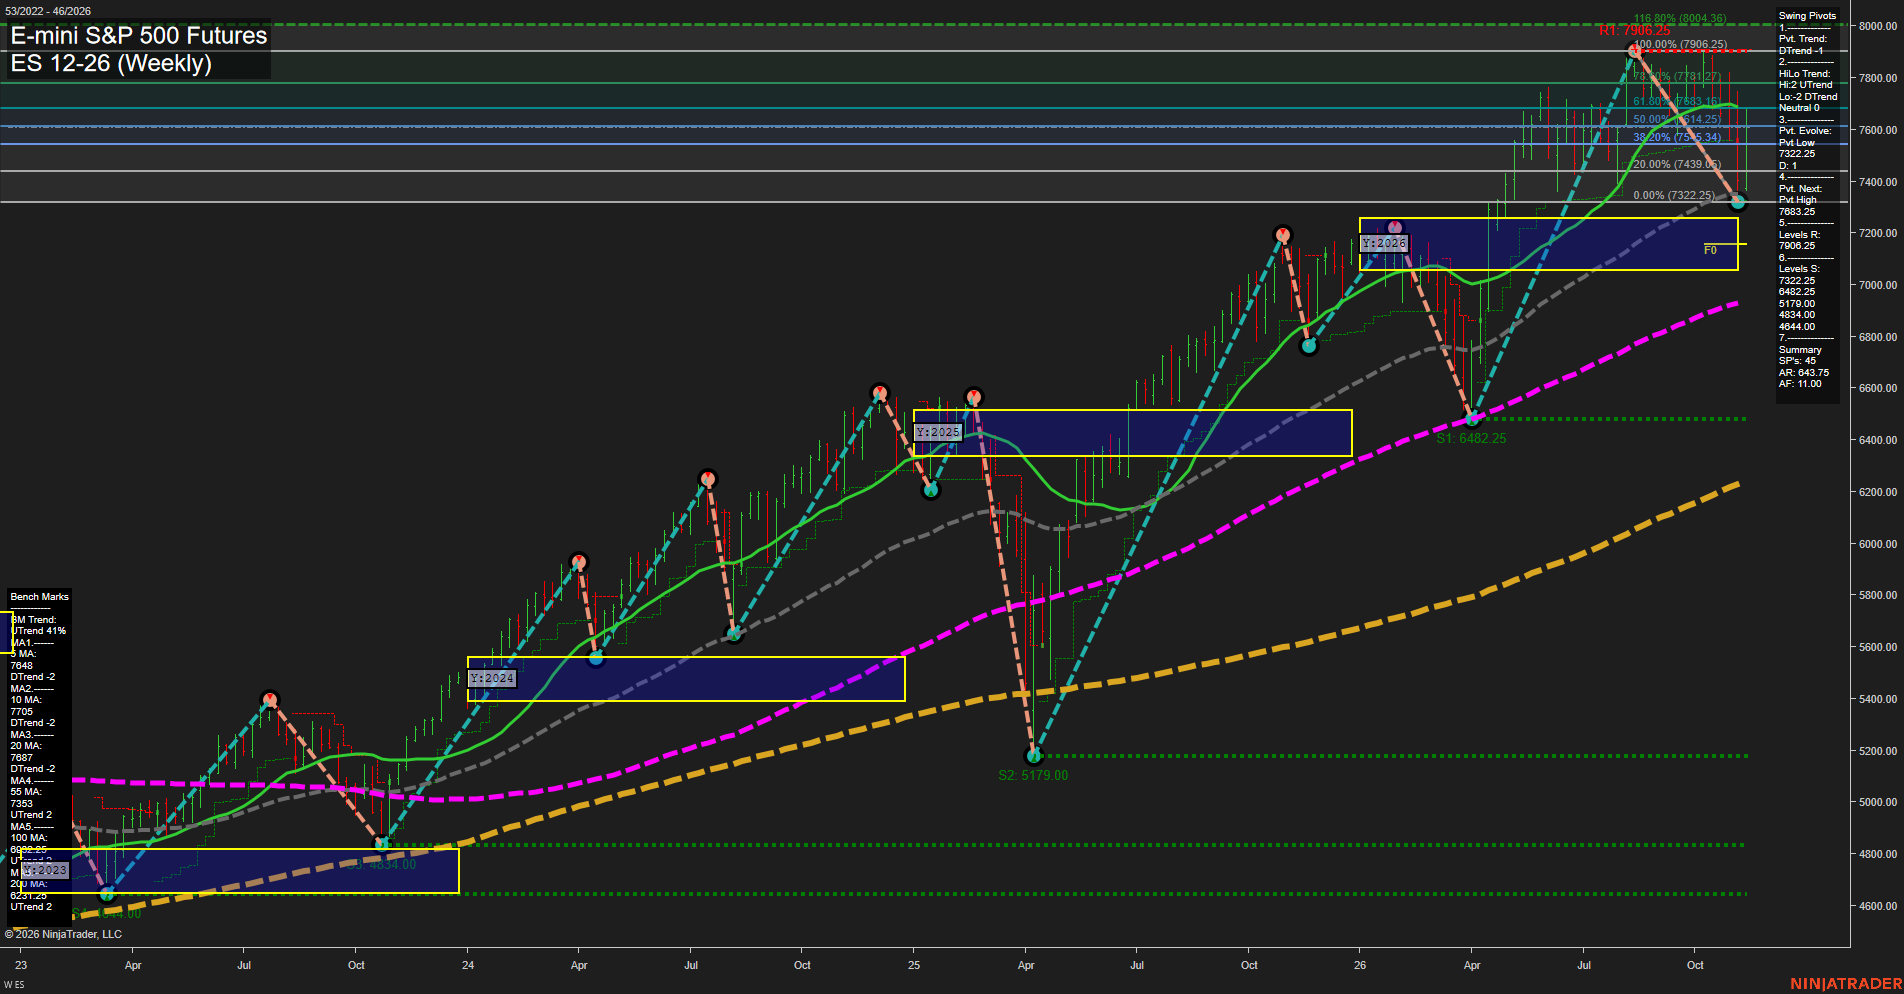
ES E-mini S&P 500 Futures Weekly Chart Analysis: 2026-Nov-12 15:05 CT
Price Action
- Last: Not legible on the supplied chart,
- Bars: Large,
- Mom: Momentum slow.
WSFG Weekly
- Short-Term
- WSFG Current: 93%
- F0%/NTZ' Bias: Price Above,
- WSFG Trend: Up.
MSFG Month Nov
- Intermediate-Term
- MSFG Current: -3%
- F0%/NTZ' Bias: Price Below,
- MSFG Trend: Down.
YSFG Year 2026
- Long-Term
- YSFG Current: 45%
- F0%/NTZ' Bias: Price Above,
- YSFG Trend: Up.
Swing Pivots
- (Short-Term) 1. Pvt. Trend: DTrend,
- (Intermediate-Term) 2. HiLo Trend: Neutral,
- 3. Pvt. Evolve: Pvt low 7322.25,
- 4. Pvt. Next: Pvt high 7683.25,
- 5. Levels R: 7906.25,
- 6. Levels S: 7322.25, 6482.25, 5179.00, 4834.00, 4644.00.
Weekly Benchmarks
- (Short-Term) 5 Day: 7648 Down Trend,
- (Short-Term) 10 Day: 7705 Down Trend,
- (Intermediate-Term) 20 Day: 7687 Down Trend,
- (Intermediate-Term) 55 Day: 7353 Up Trend,
- (Long-Term) 100 Day: 6932.25 Up Trend,
- (Long-Term) 200 Day: 6231.25 Up Trend.
Recent Trade Signals
- 11 Nov 2026: Long ES 12-26 @ 7666.75 Signals.USAR-MSFG
- 09 Nov 2026: Long ES 12-26 @ 7557.5 Signals.USAR.TR120
- 05 Nov 2026: Short ES 12-26 @ 7593.75 Signals.USAR-WSFG
Overall Rating
- Short-Term: Neutral,
- Intermediate-Term: Neutral,
- Long-Term: Bullish.
Key Insights Summary
From a futures swing trader’s perspective, this is a corrective, volatile consolidation within a broader uptrend. The decline from 7906.25 established an evolving pivot low at 7322.25, followed by a rebound toward the clustered shorter-term benchmarks around 7648–7705. Large overlapping weekly ranges and two-sided movement indicate slower directional momentum rather than a clean trend continuation. The weekly grid and newer long signals favor recovery, but the declining short-term benchmarks and active pivot downtrend leave short-term evidence mixed. Intermediate-term conditions are also divided: the monthly grid remains negative, the HiLo summary is neutral, and the 20-period benchmark declines while the 55-period benchmark rises. The summary specifically shows rising pivot highs but declining pivot lows, consistent with range expansion rather than an orderly higher-high, higher-low sequence. Long-term structure remains bullish, supported by the positive yearly grid and rising 100- and 200-period benchmarks. The chart identifies 7683.25 as the next pivot reversal threshold, 7906.25 as resistance, and 7322.25 as the nearest listed support. No news catalyst or seasonal conclusion can be verified from this chart alone.
Chart Analysis ATS AI Generated: 2026-11-12 15:05 for Informational use only, not trading advice. Terms and Risk Disclosure Copyright © 2026. Algo Trading Systems LLC.