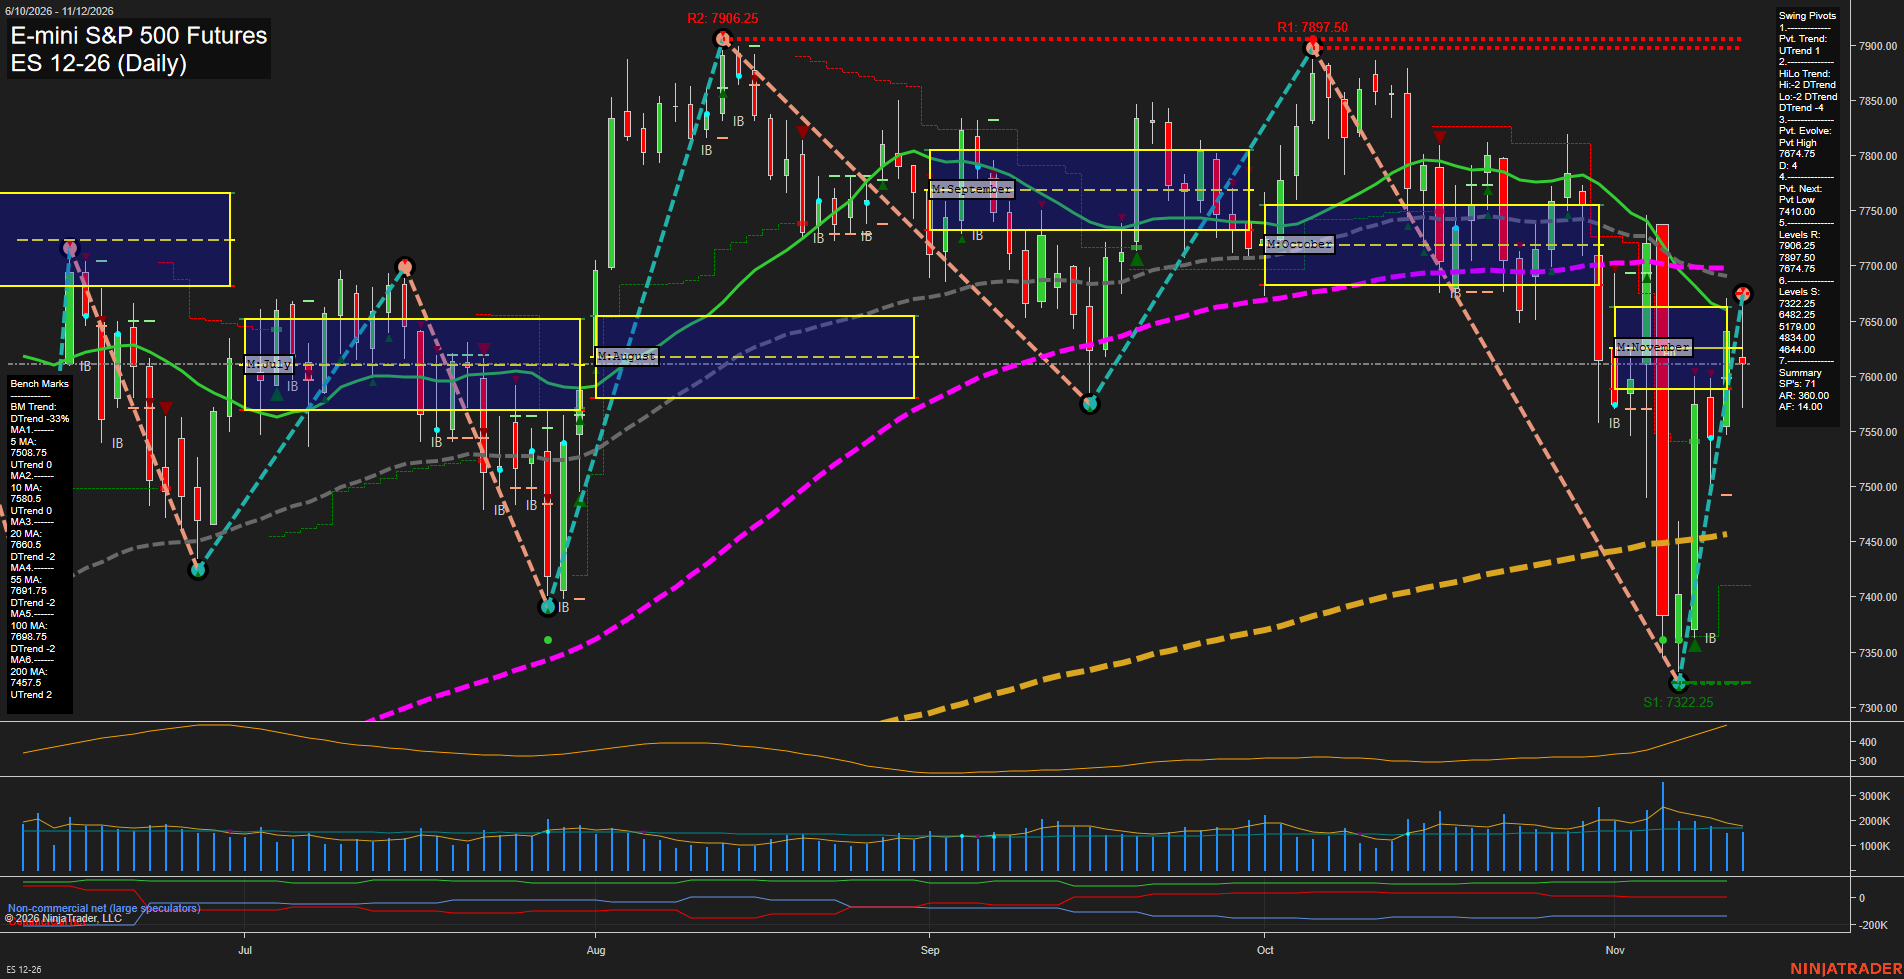
ES E-mini S&P 500 Futures Daily Chart Analysis: 2026-Nov-12 15:05 CT
Price Action
- Last: Approximately 7615; exact black price marker not legible,
- Bars: Large,
- Mom: Fast rebound momentum, slowing in the latest session.
WSFG Weekly
- Short-Term
- WSFG Current: 93%
- F0%/NTZ' Bias: Price Above,
- WSFG Trend: Up.
MSFG Month Nov
- Intermediate-Term
- MSFG Current: -3%
- F0%/NTZ' Bias: Price Below,
- MSFG Trend: Down.
YSFG Year 2026
- Long-Term
- YSFG Current: 45%
- F0%/NTZ' Bias: Price Above,
- YSFG Trend: Up.
Swing Pivots
- (Short-Term) 1. Pvt. Trend: UTrend,
- (Intermediate-Term) 2. HiLo Trend: DTrend,
- 3. Pvt. Evolve: Pvt high 7674.75,
- 4. Pvt. Next: Pvt low 7410.00,
- 5. Levels R: 7906.25, 7897.50, 7674.75,
- 6. Levels S: 7322.25, 6482.25, 5179.00, 4834.00, 4644.00.
Daily Benchmarks
- (Short-Term) 5 Day: 7508.75 Up Trend,
- (Short-Term) 10 Day: 7580.50 Up Trend,
- (Intermediate-Term) 20 Day: 7666.50 Down Trend,
- (Intermediate-Term) 55 Day: 7691.75 Down Trend,
- (Long-Term) 100 Day: 7698.75 Down Trend,
- (Long-Term) 200 Day: 7457.50 Up Trend.
Additional Metrics
- ATR: 413,
- VOLMA: 2094903.
Recent Trade Signals
- 11 Nov 2026: Long ES 12-26 @ 7666.75 Signals.USAR-MSFG
- 09 Nov 2026: Long ES 12-26 @ 7557.5 Signals.USAR.TR120
- 05 Nov 2026: Short ES 12-26 @ 7593.75 Signals.USAR-WSFG
Overall Rating
- Short-Term: Bullish,
- Intermediate-Term: Bearish,
- Long-Term: Neutral.
Key Insights Summary
The daily structure shows a sharp V-shaped recovery from 7322.25, with an evolving swing high at 7674.75. Rising 5-day and 10-day benchmarks, an upward pivot trend and positive weekly positioning support a bullish short-term assessment. The latest smaller candle indicates that the rebound is losing speed near overhead resistance. Intermediate-term conditions remain bearish: the monthly grid is negative, the high/low pivot structure remains downward, and price sits below declining 20-day and 55-day benchmarks. The recent monthly long signal therefore represents a recovery attempt rather than confirmed intermediate-term trend alignment. Resistance is concentrated around 7666.50–7698.75, followed by the major swing highs at 7897.50 and 7906.25. Longer-term evidence is mixed, with positive yearly positioning and a rising 200-day benchmark offset by a declining 100-day benchmark. Elevated ATR and the large recent daily ranges characterize a volatile countertrend rebound within a still-damaged intermediate structure. No long-term TR720 signal or news catalyst is supplied, and seasonality alone does not establish trend confirmation.
Chart Analysis ATS AI Generated: 2026-11-12 15:05 for Informational use only, not trading advice. Terms and Risk Disclosure Copyright © 2026. Algo Trading Systems LLC.