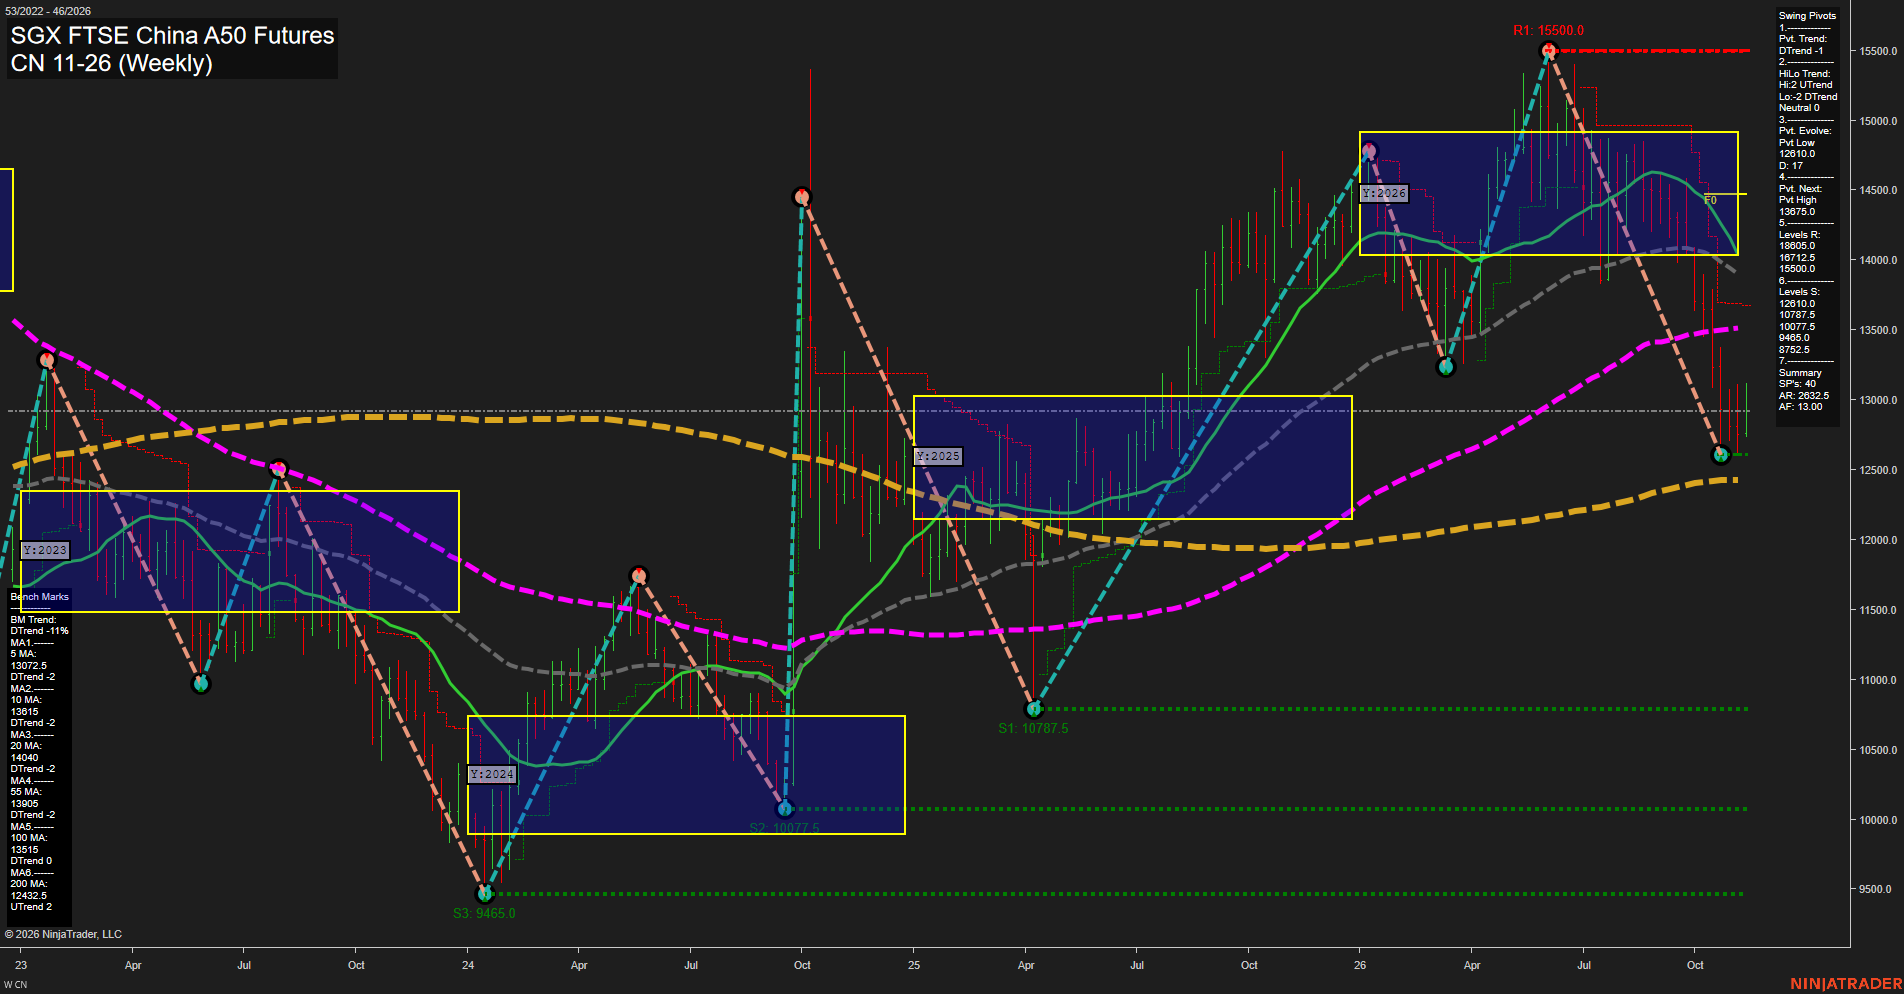
CN SGX FTSE China A50 Futures Weekly Chart Analysis: 2026-Nov-12 15:04 CT
Price Action
- Last: Approximately 12925; exact black price marker not visible,
- Bars: Medium,
- Mom: Slow rebound following fast downside momentum.
WSFG Weekly
- Short-Term
- WSFG Current: NA%
- F0%/NTZ' Bias: Price Neutral,
- WSFG Trend: Neutral.
MSFG Month Nov
- Intermediate-Term
- MSFG Current: NA%
- F0%/NTZ' Bias: Price Neutral,
- MSFG Trend: Neutral.
YSFG Year 2026
- Long-Term
- YSFG Current: NA%
- F0%/NTZ' Bias: Price below NTZ,
- YSFG Trend: Bearish.
Swing Pivots
- (Short-Term) 1. Pvt. Trend: DTrend,
- (Intermediate-Term) 2. HiLo Trend: Neutral; high pivots UTrend, low pivots DTrend,
- 3. Pvt. Evolve: Pvt low 12610,
- 4. Pvt. Next: Pvt high 13675,
- 5. Levels R: 18605, 16712.5, 15500,
- 6. Levels S: 12610, 10787.5, 10077.5, 9465, 8752.5.
Weekly Benchmarks
- (Short-Term) 5 Day: 13072.5 Down Trend,
- (Short-Term) 10 Day: 13615 Down Trend,
- (Intermediate-Term) 20 Day: 14040 Down Trend,
- (Intermediate-Term) 55 Day: 13905 Down Trend,
- (Long-Term) 100 Day: 13515 Down Trend,
- (Long-Term) 200 Day: 12432.5 Up Trend.
Overall Rating
- Short-Term: Bearish,
- Intermediate-Term: Bearish,
- Long-Term: Bearish.
Key Insights Summary
The weekly structure shows a sharp reversal from 15500 into an evolving 12610 pivot low, followed by a modest rebound rather than a confirmed upside reversal. Price remains below the five shorter benchmarks and the 2026 yearly neutral zone, supporting a bearish swing interpretation. The mixed high/low pivot summary reflects expanding swings rather than an orderly intermediate uptrend. The rising 200-period benchmark at 12432.5 remains the principal bullish long-cycle counterweight, positioned beneath the current pivot low. The next-pivot threshold is 13675, while the declining benchmarks between 13072.5 and 14040 describe substantial overhead technical pressure. Weekly and monthly grid readings and the named recent trade signals are not visible; their neutral entries represent unavailable confirmation, not established balance. News and seasonal drivers cannot be established from this chart alone.
Chart Analysis ATS AI Generated: 2026-11-12 15:04 for Informational use only, not trading advice. Terms and Risk Disclosure Copyright © 2026. Algo Trading Systems LLC.