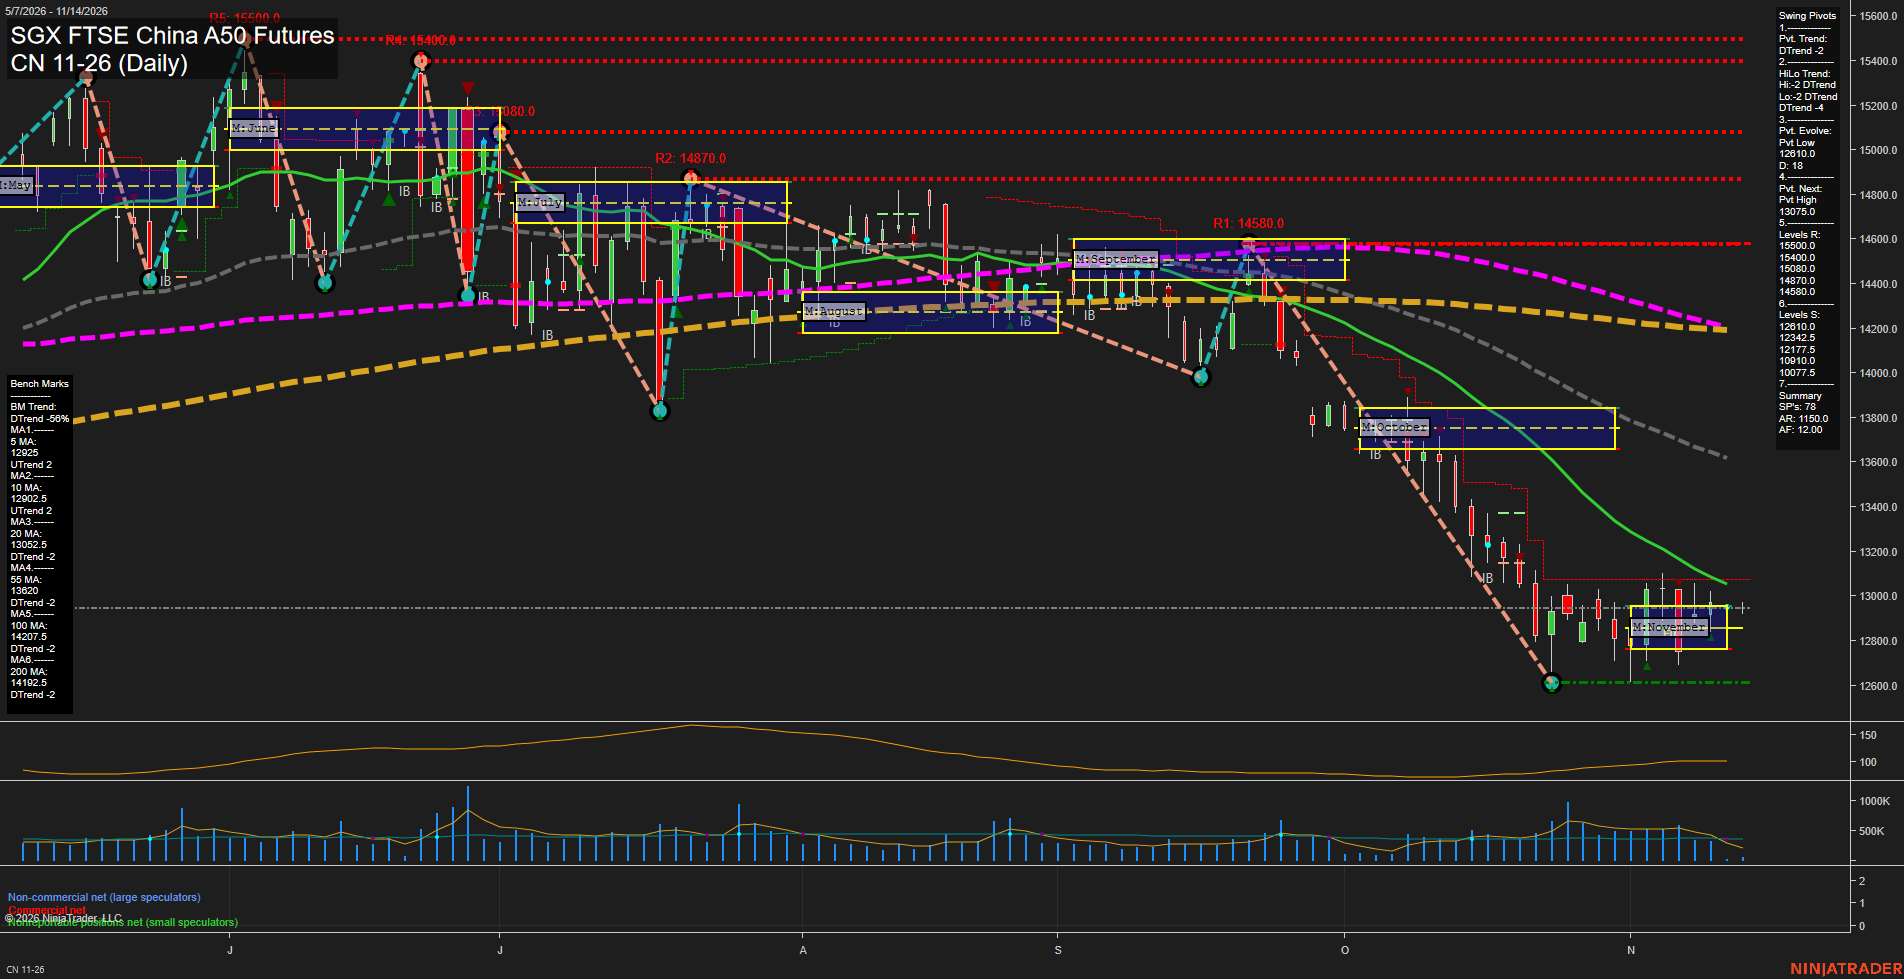
CN SGX FTSE China A50 Futures Daily Chart Analysis: 2026-Nov-12 15:04 CT
Price Action
- Last: Approximately 12950,
- Bars: Small,
- Mom: Momentum slow.
WSFG Weekly
- Short-Term
- WSFG Current: NA%
- F0%/NTZ' Bias: Price Neutral,
- WSFG Trend: Neutral.
MSFG Month Nov
- Intermediate-Term
- MSFG Current: NA%
- F0%/NTZ' Bias: Price Neutral,
- MSFG Trend: Neutral.
YSFG Year 2026
- Long-Term
- YSFG Current: NA%
- F0%/NTZ' Bias: Price Neutral,
- YSFG Trend: Neutral.
Swing Pivots
- (Short-Term) 1. Pvt. Trend: DTrend,
- (Intermediate-Term) 2. HiLo Trend: DTrend,
- 3. Pvt. Evolve: Pvt low 12610,
- 4. Pvt. Next: Pvt high 13075,
- 5. Levels R: 15500, 15400, 15080, 14870, 14580,
- 6. Levels S: 12610, 12342.5, 12177.5, 10910, 10077.5.
Daily Benchmarks
- (Short-Term) 5 Day: 12925 Up Trend,
- (Short-Term) 10 Day: 12902.5 Up Trend,
- (Intermediate-Term) 20 Day: 13052.5 Down Trend,
- (Intermediate-Term) 55 Day: 13620 Down Trend,
- (Long-Term) 100 Day: 14207.5 Down Trend,
- (Long-Term) 200 Day: 14192.5 Down Trend.
Additional Metrics
Overall Rating
- Short-Term: Bullish,
- Intermediate-Term: Bearish,
- Long-Term: Bearish.
Key Insights Summary
Short-term stabilization contrasts with an established broader downtrend. Price is marginally above the rising 5- and 10-day benchmarks, giving the short-term metric balance a bullish tilt despite the bearish pivot trend. Small recent candles and sideways November trading indicate a slow countertrend recovery rather than an established upside reversal. The evolving 12610 pivot low remains the nearest listed swing support; the 13052.5 declining 20-day benchmark and 13075 next-pivot threshold frame nearby overhead resistance. Both intermediate benchmarks and both long-term benchmarks remain declining above price, consistent with the larger sequence of lower highs and lower lows. November price is near the upper boundary of its monthly neutral zone, but broader trend repair is not yet evident. Weekly and yearly grids and named trade-signal readings are not visible, so their directional confirmation is unavailable. News and seasonal explanations cannot be established from this chart alone.
Chart Analysis ATS AI Generated: 2026-11-12 15:04 for Informational use only, not trading advice. Terms and Risk Disclosure Copyright © 2026. Algo Trading Systems LLC.