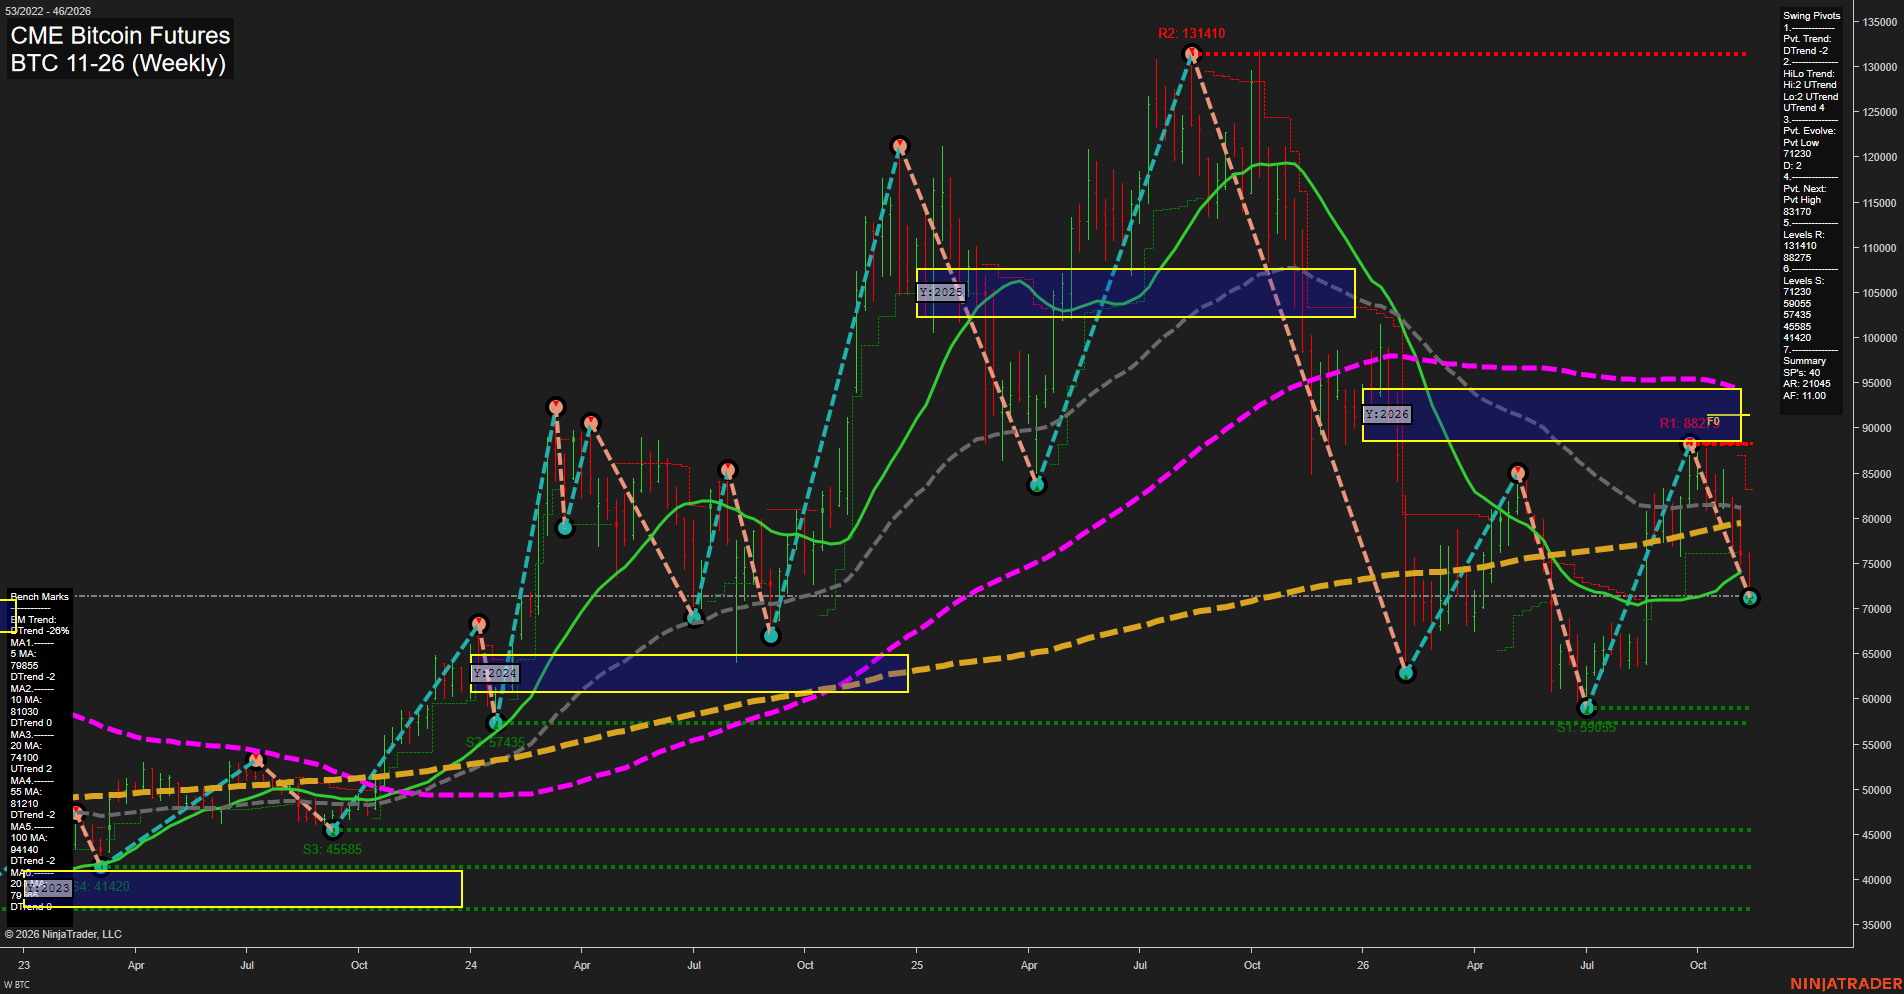
BTC CME Bitcoin Futures Weekly Chart Analysis: 2026-Nov-12 15:03 CT
Price Action
- Last: Approximately 71,400; exact black price marker not visible,
- Bars: Large,
- Mom: Momentum fast.
WSFG Weekly
- Short-Term
- WSFG Current: -83%
- F0%/NTZ' Bias: Price Below,
- WSFG Trend: Down.
MSFG Month Nov
- Intermediate-Term
- MSFG Current: -44%
- F0%/NTZ' Bias: Price Below,
- MSFG Trend: Down.
YSFG Year 2026
- Long-Term
- YSFG Current: -69%
- F0%/NTZ' Bias: Price Below,
- YSFG Trend: Down.
Swing Pivots
- (Short-Term) 1. Pvt. Trend: DTrend,
- (Intermediate-Term) 2. HiLo Trend: UTrend,
- 3. Pvt. Evolve: Pvt low 71230,
- 4. Pvt. Next: Pvt high 83170,
- 5. Levels R: 131410, 88275,
- 6. Levels S: 71230, 59055, 57435, 45585, 41420.
Weekly Benchmarks
- (Short-Term) 5 Day: 79855 Down Trend,
- (Short-Term) 10 Day: 81030 Down Trend,
- (Intermediate-Term) 20 Day: 74100 Up Trend,
- (Intermediate-Term) 55 Day: 81210 Down Trend,
- (Long-Term) 100 Day: 94140 Down Trend,
- (Long-Term) 200 Day: Price obscured Up Trend.
Recent Trade Signals
- 09 Nov 2026: Short BTC 11-26 @ 74740 Signals.USAR-MSFG
Overall Rating
- Short-Term: Bearish,
- Intermediate-Term: Bearish,
- Long-Term: Bearish.
Key Insights Summary
From a futures swing-trading perspective, the dominant feature is a sharp downswing from 88,275 toward the evolving 71,230 pivot low. Large weekly ranges indicate forceful selling rather than quiet consolidation. The short-term pivot downtrend, negative session-grid readings across all three horizons, and November monthly short signal reinforce the bearish direction. Intermediate-term structure remains mixed: the pivot summary still reports higher highs and higher lows, but price has fallen beneath the rising 74,100 benchmark and the declining shorter benchmarks. The 83,170 next-pivot reversal threshold is distinct from established resistance at 88,275. Beneath 71,230, listed support shifts to 59,055 and 57,435. Longer-term weakness is reflected in price below the yearly neutral zone and declining 94,140 benchmark, although the rising 200-period benchmark provides a residual positive trend component. The chart supports a bearish trend assessment with an unresolved intermediate-term uptrend, rather than a confirmed reversal higher; news and seasonal explanations cannot be established from this image alone.
Chart Analysis ATS AI Generated: 2026-11-12 15:03 for Informational use only, not trading advice. Terms and Risk Disclosure Copyright © 2026. Algo Trading Systems LLC.