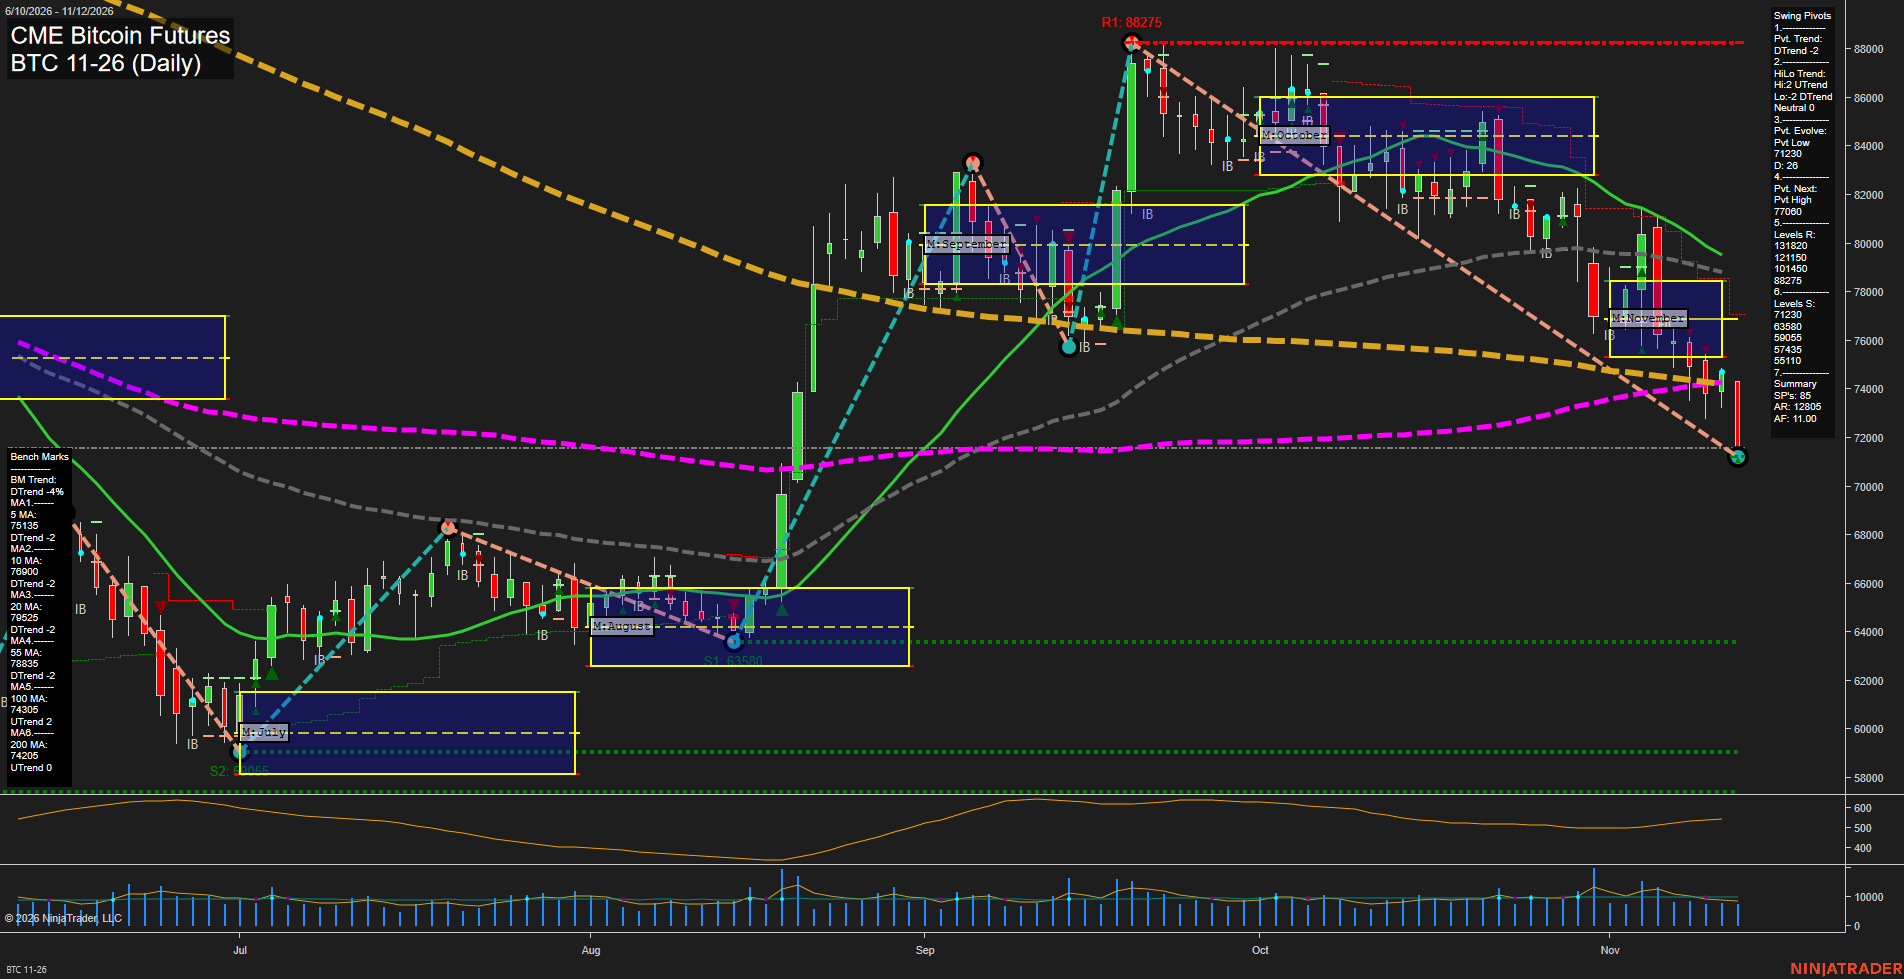
BTC CME Bitcoin Futures Daily Chart Analysis: 2026-Nov-12 15:03 CT
Price Action
- Last: Approximately 71600,
- Bars: Large,
- Mom: Momentum fast.
WSFG Weekly
- Short-Term
- WSFG Current: -83%
- F0%/NTZ' Bias: Price Below,
- WSFG Trend: Down.
MSFG Month Nov
- Intermediate-Term
- MSFG Current: -44%
- F0%/NTZ' Bias: Price Below,
- MSFG Trend: Down.
YSFG Year 2026
- Long-Term
- YSFG Current: -69%
- F0%/NTZ' Bias: Price Below,
- YSFG Trend: Down.
Swing Pivots
- (Short-Term) 1. Pvt. Trend: DTrend,
- (Intermediate-Term) 2. HiLo Trend: DTrend,
- 3. Pvt. Evolve: Pvt low 71230,
- 4. Pvt. Next: Pvt high 77060,
- 5. Levels R: 131820, 121150, 101450, 88275,
- 6. Levels S: 71230, 63580, 59055, 57435, 55110.
Daily Benchmarks
- (Short-Term) 5 Day: 75135 Down Trend,
- (Short-Term) 10 Day: 76900 Down Trend,
- (Intermediate-Term) 20 Day: 79525 Down Trend,
- (Intermediate-Term) 55 Day: 78835 Down Trend,
- (Long-Term) 100 Day: 74305 Up Trend,
- (Long-Term) 200 Day: 74205 Up Trend.
Additional Metrics
Recent Trade Signals
- 09 Nov 2026: Short BTC 11-26 @ 74740 Signals.USAR-MSFG
Overall Rating
- Short-Term: Bearish,
- Intermediate-Term: Bearish,
- Long-Term: Neutral.
Key Insights Summary
The swing structure shows a sustained decline from 88275, with lower highs and an evolving low at 71230. The latest large bearish candle extends the selloff below November’s NTZ and all six benchmarks, indicating downside acceleration rather than consolidation. Weekly and monthly grid readings, falling short- and intermediate-term averages, and the recent monthly short signal reinforce the bearish alignment. The 74205–74305 long-term benchmark cluster now sits above price, although both averages retain upward trend readings; this leaves the long-term assessment mixed rather than uniformly bearish. The next opposite-pivot threshold is 77060, while 71230 marks the immediate support reference, followed by 63580. The last price is estimated from the chart because a black last-price marker is not clearly visible. No news or seasonal evidence is supplied to establish a separate catalyst.
Chart Analysis ATS AI Generated: 2026-11-12 15:03 for Informational use only, not trading advice. Terms and Risk Disclosure Copyright © 2026. Algo Trading Systems LLC.