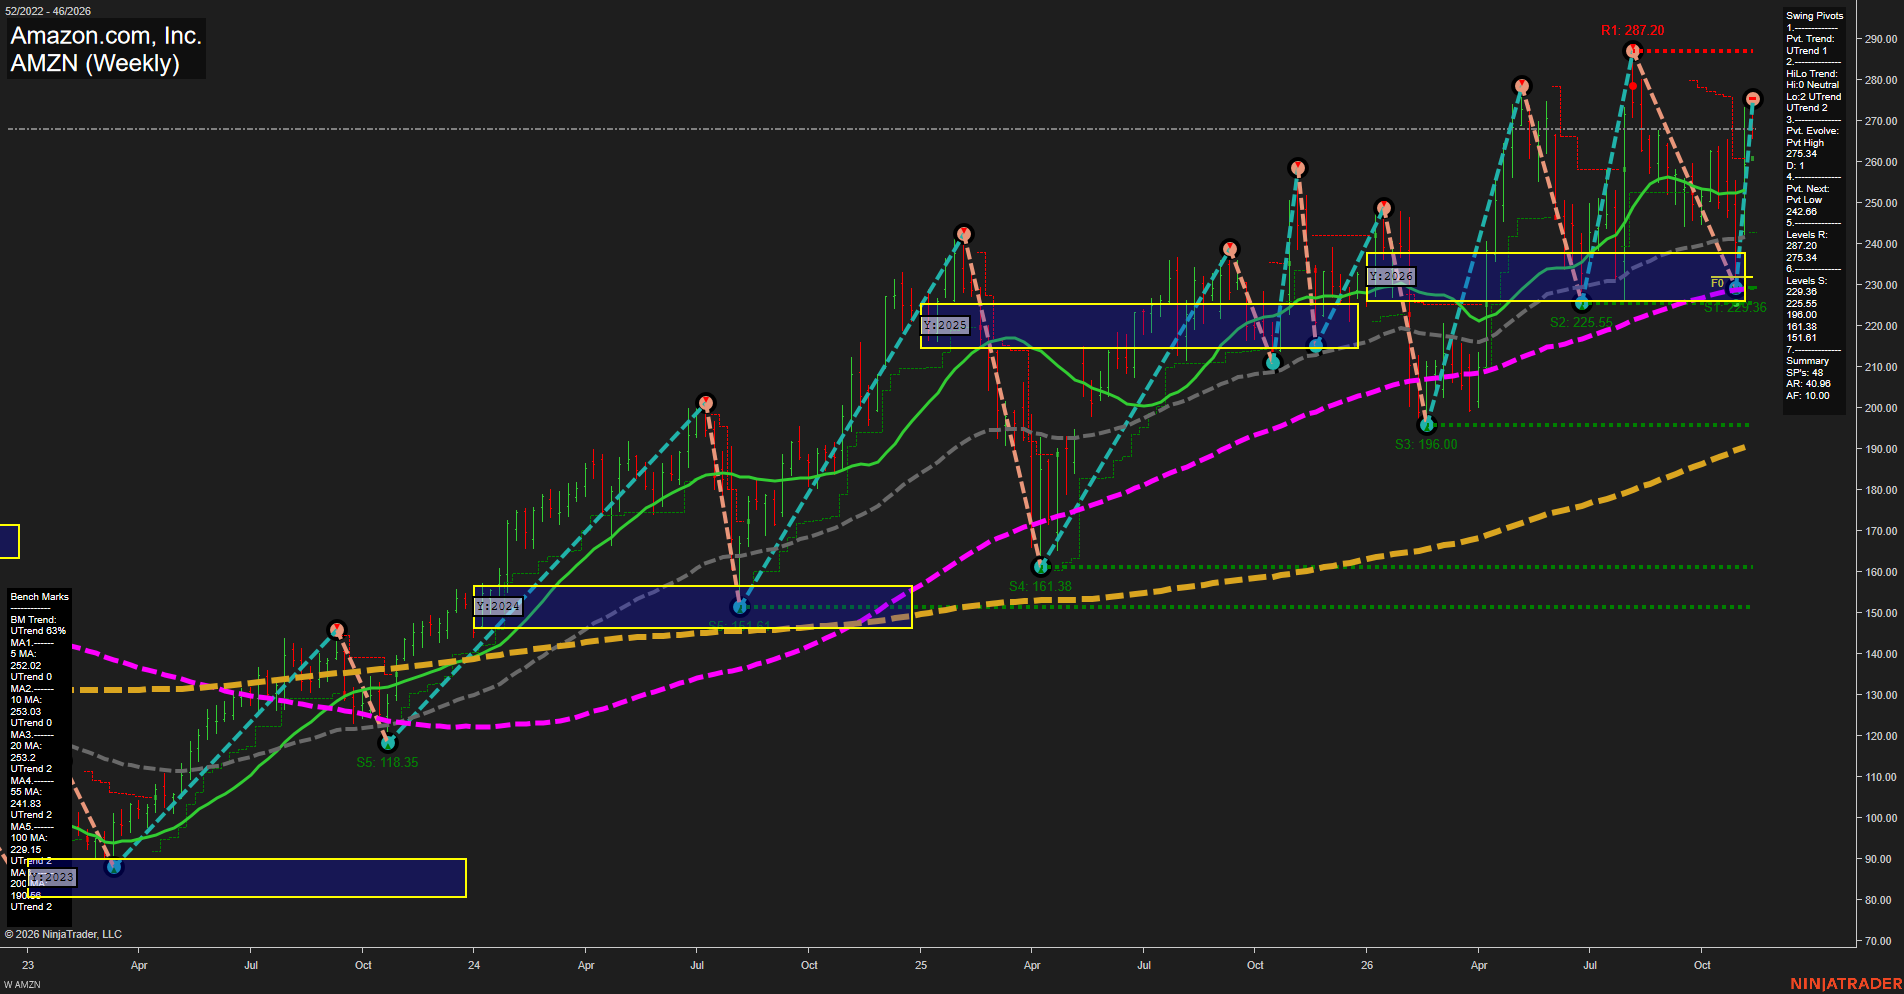
AMZN Amazon.com; Inc. Weekly Chart Analysis: 2026-Nov-12 15:03 CT
Price Action
- Last: Not explicitly displayed; dashed price reference near 268,
- Bars: Large,
- Mom: Momentum fast.
WSFG Weekly
- Short-Term
- WSFG Current: NA%
- F0%/NTZ' Bias: Price Neutral,
- WSFG Trend: Neutral.
MSFG Month Nov
- Intermediate-Term
- MSFG Current: NA%
- F0%/NTZ' Bias: Price Neutral,
- MSFG Trend: Neutral.
YSFG Year 2026
- Long-Term
- YSFG Current: NA%
- F0%/NTZ' Bias: Price above NTZ,
- YSFG Trend: Bullish.
Swing Pivots
- (Short-Term) 1. Pvt. Trend: UTrend,
- (Intermediate-Term) 2. HiLo Trend: UTrend,
- 3. Pvt. Evolve: Pvt high 275.34,
- 4. Pvt. Next: Pvt low 242.66,
- 5. Levels R: 287.20, 275.34,
- 6. Levels S: 229.36, 225.55, 196.00, 161.38, 151.61.
Weekly Benchmarks
- (Short-Term) 5 Day: 252.02 Up Trend,
- (Short-Term) 10 Day: 253.03 Up Trend,
- (Intermediate-Term) 20 Day: 253.20 Up Trend,
- (Intermediate-Term) 55 Day: 241.83 Up Trend,
- (Long-Term) 100 Day: 229.15 Up Trend,
- (Long-Term) 200 Day: 190.68 Up Trend.
Overall Rating
- Short-Term: Bullish,
- Intermediate-Term: Bullish,
- Long-Term: Bullish.
Key Insights Summary
From a futures swing-trader perspective, this equity chart shows a fast recovery leg within a broader rising trend, rather than a confirmed breakout to new highs. The rebound from 229.36 has developed an evolving pivot high at 275.34, below resistance at 287.20. Both pivot trends remain upward, although the summary identifies neutral high-pivot progression and rising lows, indicating stronger support progression than upside expansion. Price is above all six rising benchmarks and the annual neutral zone, supporting bullish alignment across time horizons. Large recent weekly ranges and repeated sharp reversals characterize a volatile, two-way market within that broader uptrend. The 242.66 next-pivot threshold defines the chart's short-term reversal reference, while 229.36 and 225.55 mark established swing support. Weekly and monthly grid readings and the specified recent trade signals are not displayed; their absence is not evidence of confirmed neutral momentum. No news or seasonal catalyst can be established from this chart alone.
Chart Analysis ATS AI Generated: 2026-11-12 15:03 for Informational use only, not trading advice. Terms and Risk Disclosure Copyright © 2026. Algo Trading Systems LLC.