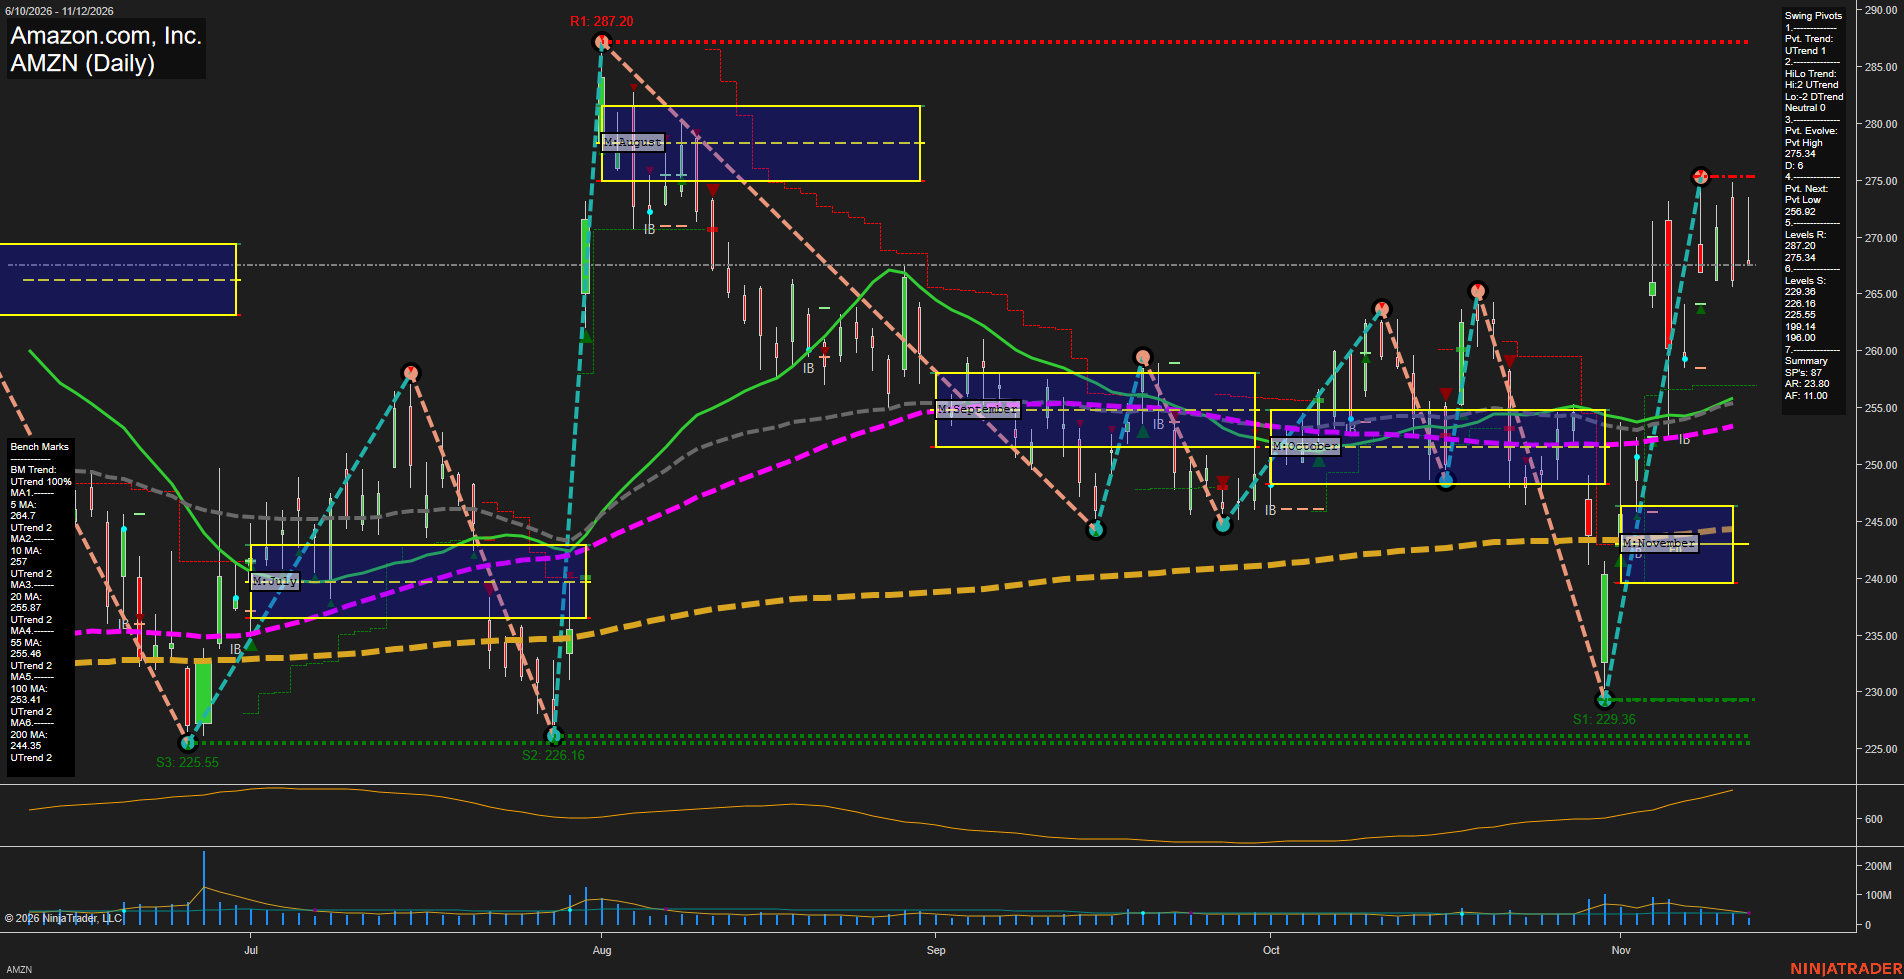
AMZN Amazon.com; Inc. Daily Chart Analysis: 2026-Nov-12 15:02 CT
Price Action
- Last: Approximately 267.60; exact black price marker not visible,
- Bars: Large,
- Mom: Fast rebound momentum, slowing near resistance.
WSFG Weekly
- Short-Term
- WSFG Current: NA%
- F0%/NTZ' Bias: Price Neutral; weekly grid not displayed,
- WSFG Trend: Neutral; unconfirmed.
MSFG Month Nov
- Intermediate-Term
- MSFG Current: NA%
- F0%/NTZ' Bias: Price Bullish; above November F0% and NTZ,
- MSFG Trend: Bullish.
YSFG Year 2026
- Long-Term
- YSFG Current: NA%
- F0%/NTZ' Bias: Price Neutral; yearly grid not displayed,
- YSFG Trend: Neutral; unconfirmed.
Swing Pivots
- (Short-Term) 1. Pvt. Trend: UTrend,
- (Intermediate-Term) 2. HiLo Trend: Neutral; high pivots UTrend and low pivots DTrend,
- 3. Pvt. Evolve: Pvt high 275.34,
- 4. Pvt. Next: Pvt low 256.92,
- 5. Levels R: 287.20, 275.34,
- 6. Levels S: 229.36, 226.16, 225.55, 199.14, 196.00.
Daily Benchmarks
- (Short-Term) 5 Day: 264.70 Up Trend,
- (Short-Term) 10 Day: 257.00 Up Trend,
- (Intermediate-Term) 20 Day: 255.87 Up Trend,
- (Intermediate-Term) 55 Day: 255.46 Up Trend,
- (Long-Term) 100 Day: 253.41 Up Trend,
- (Long-Term) 200 Day: 244.35 Up Trend.
Additional Metrics
- ATR: 465,
- VOLMA: 33608198.
Overall Rating
- Short-Term: Bullish,
- Intermediate-Term: Bullish,
- Long-Term: Bullish.
Key Insights Summary
From a futures swing trader’s perspective, this equity chart shows a fast, volatility-expanding V-recovery from 229.36 to 275.34, followed by a pullback and wide-range consolidation beneath resistance. Price remains above all six rising benchmarks and November’s monthly neutral zone, supporting bullish directional alignment. Intermediate swing structure is less decisive because rising pivot highs coexist with declining pivot lows, indicating an expanding range rather than an orderly higher-high/higher-low trend. The 255–257 benchmark cluster overlaps the 256.92 next-pivot reversal threshold, while overhead resistance stands at 275.34 and 287.20. ATR is rising visually, emphasizing larger daily movement rather than a quiet consolidation. The supplied ATR value is reproduced without independently confirming its units. Weekly and yearly grids, the four named trading-signal series, and news catalysts are not displayed, so their direction or contribution cannot be verified. This is AMZN equity analysis, not a futures-contract or futures-volume assessment.
Chart Analysis ATS AI Generated: 2026-11-12 15:03 for Informational use only, not trading advice. Terms and Risk Disclosure Copyright © 2026. Algo Trading Systems LLC.