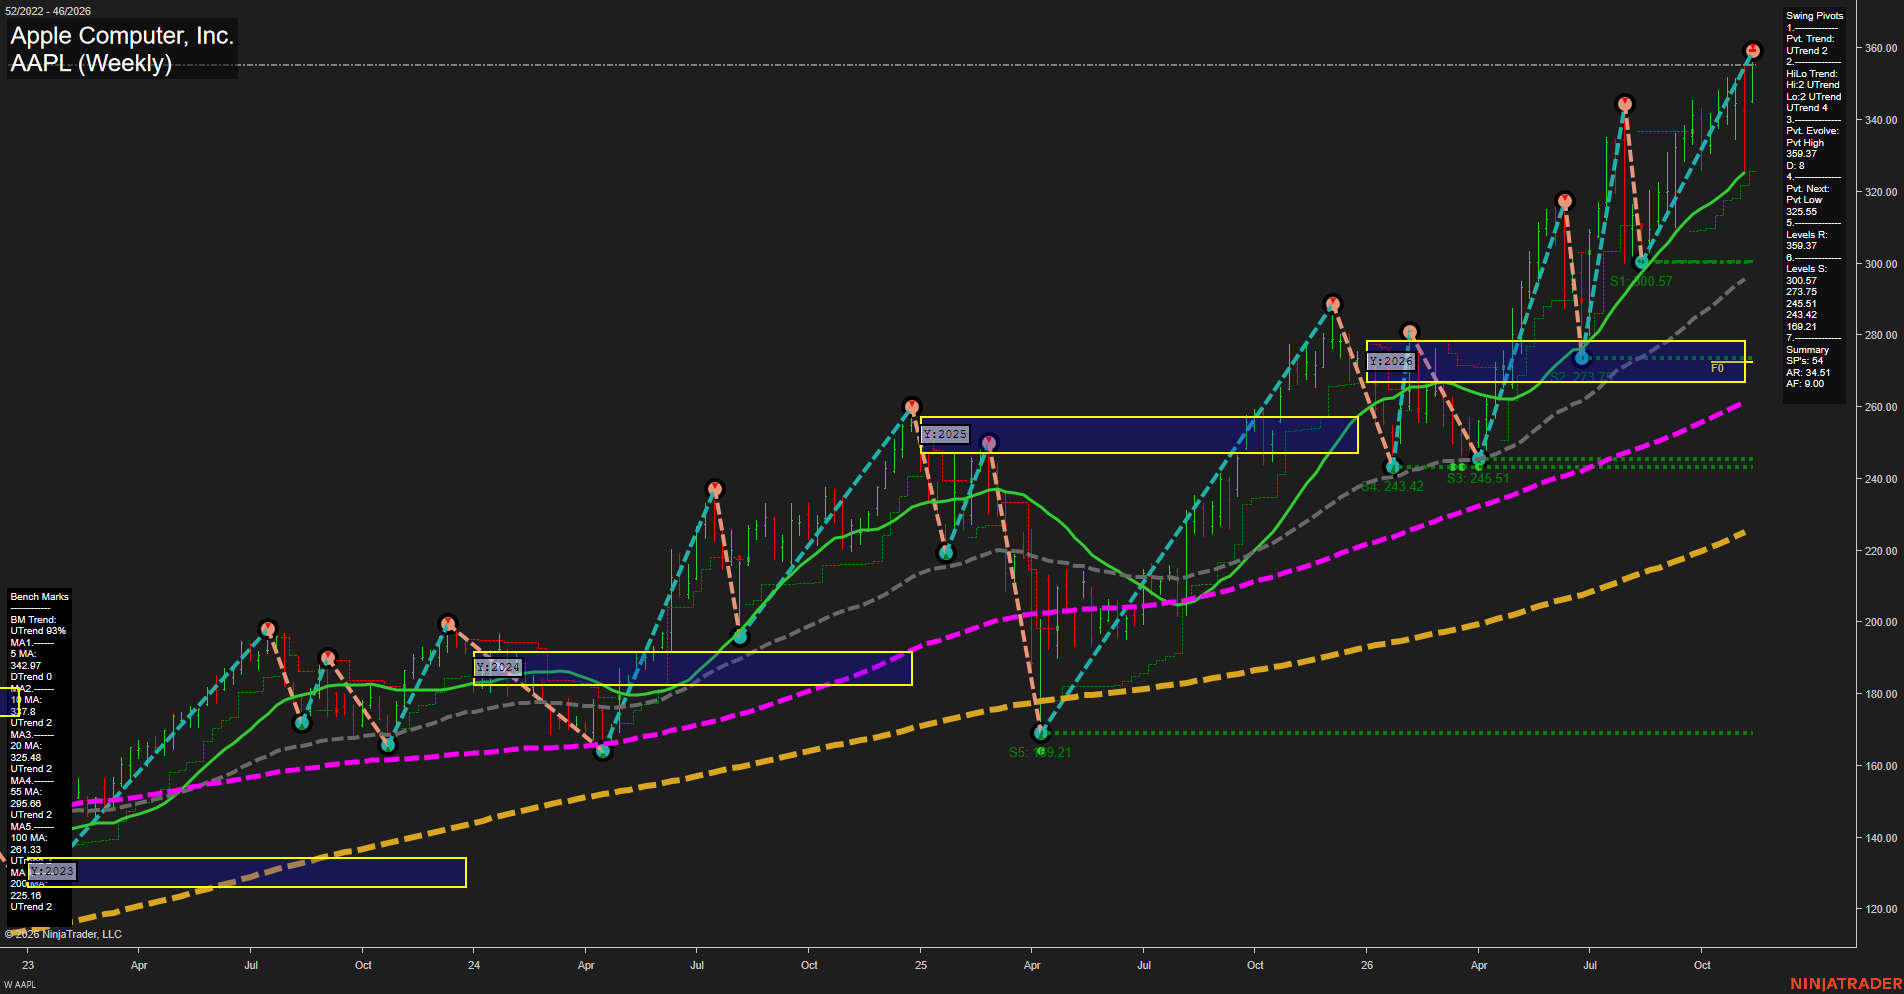
AAPL Apple Computer; Inc. Weekly Chart Analysis: 2026-Nov-12 15:02 CT
Price Action
- Last: Not legible on the supplied chart,
- Bars: Large,
- Mom: Momentum fast.
WSFG Weekly
- Short-Term
- WSFG Current: NA%
- F0%/NTZ' Bias: Price Neutral,
- WSFG Trend: Neutral.
MSFG Month Nov
- Intermediate-Term
- MSFG Current: NA%
- F0%/NTZ' Bias: Price Neutral,
- MSFG Trend: Neutral.
YSFG Year 2026
- Long-Term
- YSFG Current: NA%
- F0%/NTZ' Bias: Price Above NTZ,
- YSFG Trend: Bullish.
Swing Pivots
- (Short-Term) 1. Pvt. Trend: UTrend,
- (Intermediate-Term) 2. HiLo Trend: UTrend,
- 3. Pvt. Evolve: Pvt high 359.37,
- 4. Pvt. Next: Pvt low 325.55,
- 5. Levels R: 359.37,
- 6. Levels S: 300.57, 273.75, 245.51, 243.42, 169.21.
Weekly Benchmarks
- (Short-Term) 5 Day: 342.97 Down Trend,
- (Short-Term) 10 Day: Approximately 337.8 Up Trend,
- (Intermediate-Term) 20 Day: 325.48 Up Trend,
- (Intermediate-Term) 55 Day: Approximately 295.66 Up Trend,
- (Long-Term) 100 Day: 261.33 Up Trend,
- (Long-Term) 200 Day: 225.16 Up Trend.
Overall Rating
- Short-Term: Bullish,
- Intermediate-Term: Bullish,
- Long-Term: Bullish.
Key Insights Summary
From a futures swing trader’s perspective, this underlying equity chart shows bullish directional structure with substantial weekly volatility. Higher pivot highs and higher pivot lows support trend continuation, while the declining five-period benchmark indicates a short-term momentum interruption within that broader advance. The evolving high at 359.37 defines immediate resistance; 325.55 is the displayed opposite-pivot reversal threshold, distinct from confirmed swing support at 300.57. Rising intermediate- and long-term benchmarks and price above the 2026 yearly neutral zone reinforce the bullish backdrop. Wide weekly ranges and separation from longer-term averages indicate an extended, volatile advance rather than tight consolidation. Weekly and monthly grids and the specified recent trade-signal indicators are not displayed; their neutral entries represent unavailable confirmation, not verified neutral signals. The image provides no basis for attributing the move to news or seasonality, and it does not show futures-specific basis, volume, or open interest.
Chart Analysis ATS AI Generated: 2026-11-12 15:02 for Informational use only, not trading advice. Terms and Risk Disclosure Copyright © 2026. Algo Trading Systems LLC.