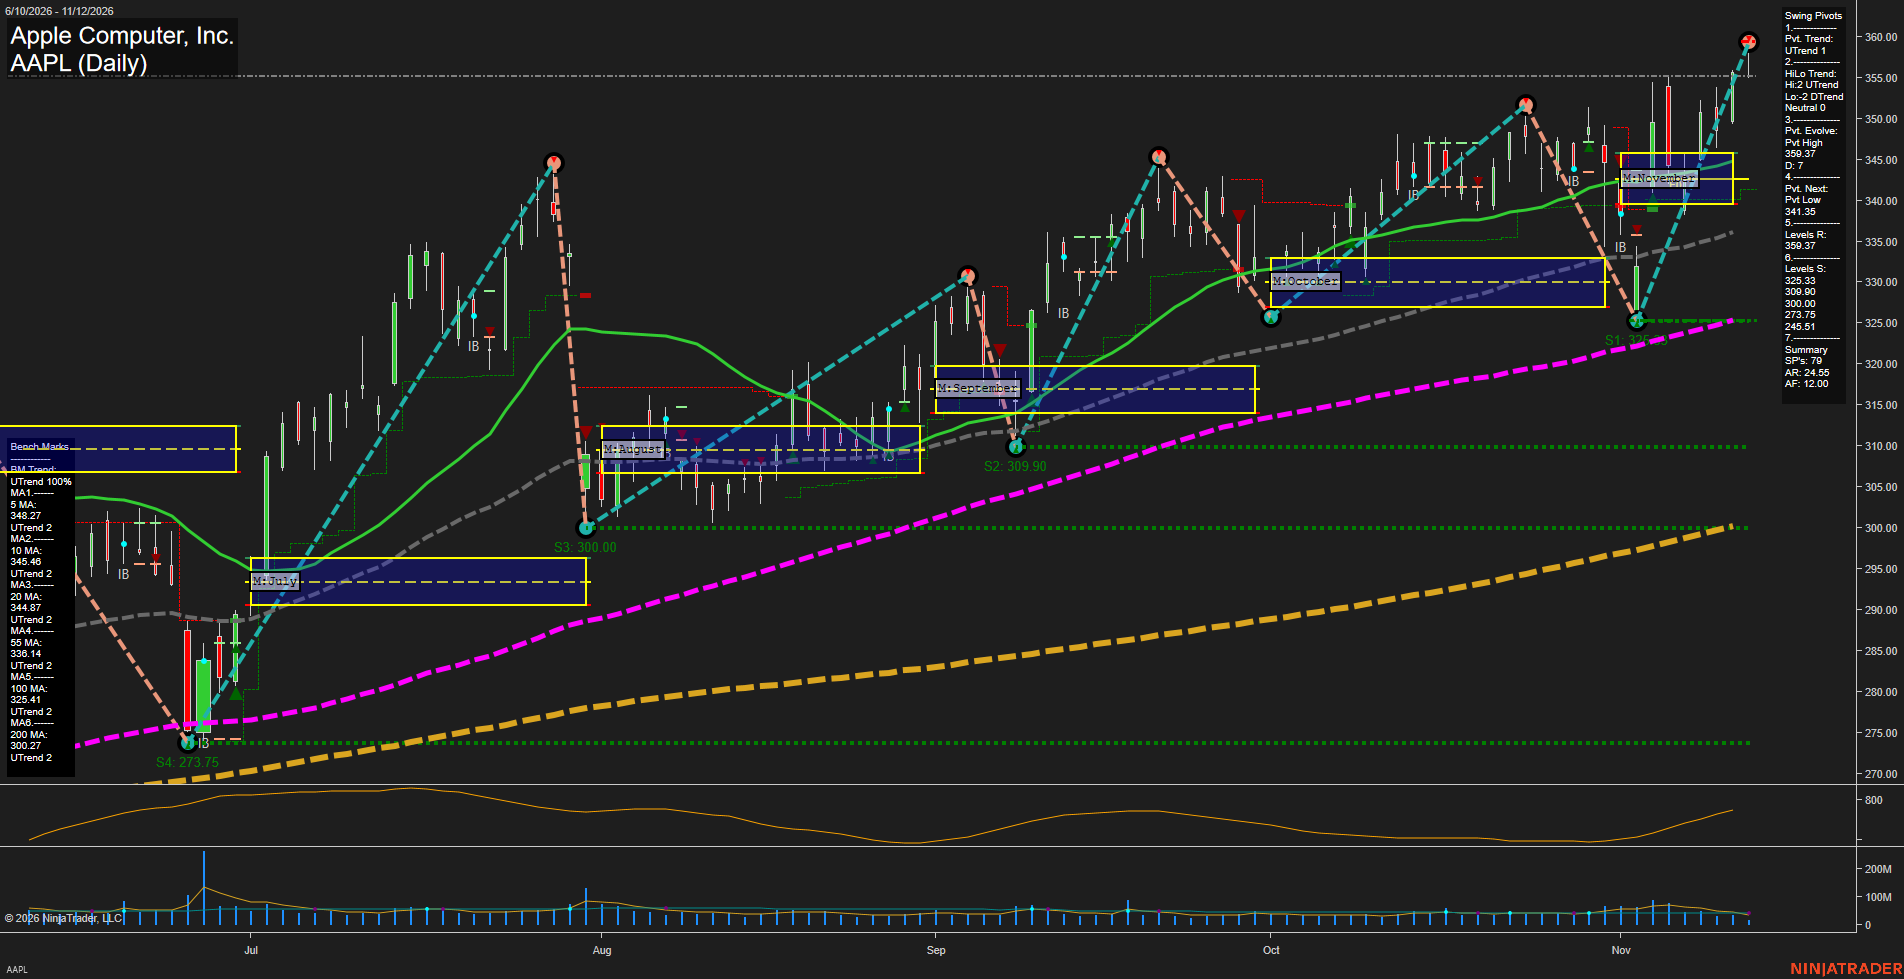
AAPL Apple Computer; Inc. Daily Chart Analysis: 2026-Nov-12 15:02 CT
Price Action
- Last: Approximately 355.20; black price marker not legible,
- Bars: Large,
- Mom: Momentum fast.
WSFG Weekly
- Short-Term
- WSFG Current: NA%
- F0%/NTZ' Bias: Price Neutral; weekly grid not shown,
- WSFG Trend: Neutral; unconfirmed.
MSFG Month Nov
- Intermediate-Term
- MSFG Current: NA%
- F0%/NTZ' Bias: Price above F0% and NTZ; bullish,
- MSFG Trend: Bullish.
YSFG Year 2026
- Long-Term
- YSFG Current: NA%
- F0%/NTZ' Bias: Price Neutral; yearly grid not shown,
- YSFG Trend: Neutral; unconfirmed.
Swing Pivots
- (Short-Term) 1. Pvt. Trend: UTrend,
- (Intermediate-Term) 2. HiLo Trend: Neutral; high pivots UTrend, low pivots DTrend,
- 3. Pvt. Evolve: Pvt high 359.37,
- 4. Pvt. Next: Pvt low 341.35,
- 5. Levels R: 359.37,
- 6. Levels S: 325.33, 309.90, 300.00, 273.75, 245.51.
Daily Benchmarks
- (Short-Term) 5 Day: 348.27 Up Trend,
- (Short-Term) 10 Day: 345.46 Up Trend,
- (Intermediate-Term) 20 Day: 344.87 Up Trend,
- (Intermediate-Term) 55 Day: 336.14 Up Trend,
- (Long-Term) 100 Day: 325.41 Up Trend,
- (Long-Term) 200 Day: 300.27 Up Trend.
Additional Metrics
- ATR: 520,
- VOLMA: 60967488.
Overall Rating
- Short-Term: Bullish,
- Intermediate-Term: Bullish,
- Long-Term: Bullish.
Key Insights Summary
From a futures swing trader’s perspective, this equity chart shows an impulsive recovery from 325.33 into the developing 359.37 pivot high, exceeding the prior October high. Price is above November’s monthly neutral zone and all six rising benchmarks, supporting bullish trend alignment across time horizons. The intermediate pivot structure remains mixed: higher highs coexist with a lower swing low, so the rally has not yet established a fully aligned higher-high/higher-low sequence. The latest retreat from 359.37 represents a pullback within the short-term advance; 341.35 is the displayed opposite-pivot reversal threshold, not an established support pivot. Rising ATR indicates expanding daily movement, while recent volume does not visibly show a sustained breakout surge. ATR and VOLMA above retain the supplied values; ATR scaling is unspecified. Weekly and yearly grids, named USAR signal readings, and news catalysts are not available in the image. This is an AAPL stock chart, so futures-specific conclusions about contract volume, roll effects, or positioning cannot be drawn.
Chart Analysis ATS AI Generated: 2026-11-12 15:02 for Informational use only, not trading advice. Terms and Risk Disclosure Copyright © 2026. Algo Trading Systems LLC.