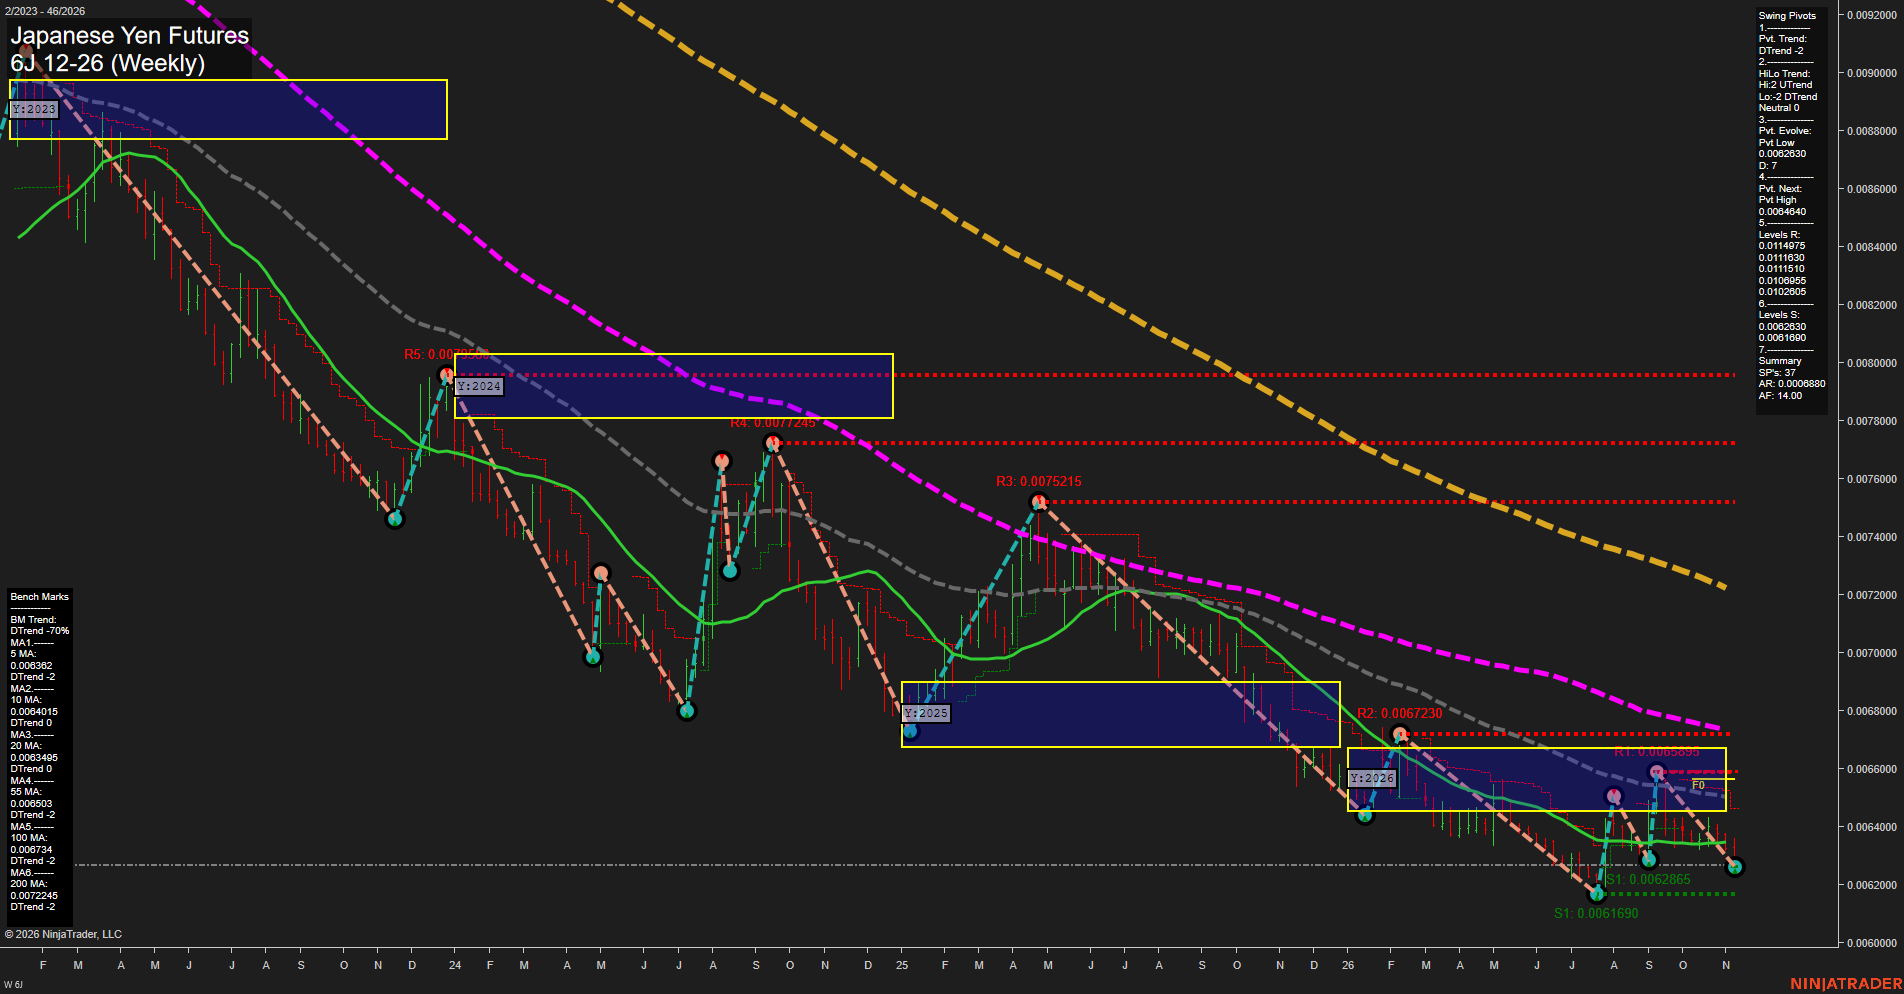
6J Japanese Yen Futures Weekly Chart Analysis: 2026-Nov-12 15:01 CT
Price Action
- Last: Approximately 0.0062700,
- Bars: Small,
- Mom: Momentum slow.
WSFG Weekly
- Short-Term
- WSFG Current: -85%
- F0%/NTZ' Bias: Price Below,
- WSFG Trend: Down.
MSFG Month Nov
- Intermediate-Term
- MSFG Current: -46%
- F0%/NTZ' Bias: Price Below,
- MSFG Trend: Down.
YSFG Year 2026
- Long-Term
- YSFG Current: -27%
- F0%/NTZ' Bias: Price Below,
- YSFG Trend: Down.
Swing Pivots
- (Short-Term) 1. Pvt. Trend: DTrend,
- (Intermediate-Term) 2. HiLo Trend: Neutral; high pivots UTrend, low pivots DTrend,
- 3. Pvt. Evolve: Pvt low 0.0062630,
- 4. Pvt. Next: Pvt high 0.0064640,
- 5. Levels R: 0.0114975, 0.0111630, 0.0111510, 0.0106955, 0.0102805,
- 6. Levels S: 0.0062630, 0.0061690.
Weekly Benchmarks
- (Short-Term) 5 Day: 0.0063620 Down Trend,
- (Short-Term) 10 Day: 0.0064015 Down Trend,
- (Intermediate-Term) 20 Day: 0.0063495 Down Trend,
- (Intermediate-Term) 55 Day: 0.0065030 Down Trend,
- (Long-Term) 100 Day: 0.0067340 Down Trend,
- (Long-Term) 200 Day: 0.0072245 Down Trend.
Recent Trade Signals
- 10 Nov 2026: Short 6J 12-26 @ 0.0063185 Signals.USAR-WSFG
- 10 Nov 2026: Short 6J 12-26 @ 0.0063185 Signals.USAR.TR120
Overall Rating
- Short-Term: Bearish,
- Intermediate-Term: Bearish,
- Long-Term: Bearish.
Key Insights Summary
The weekly structure remains a sustained bear trend, with price below every benchmark and all three session grids pointing down. Recent rebounds have failed to establish a durable recovery, leaving price near evolving pivot support at 0.0062630, above the deeper 0.0061690 low. Small recent bars suggest a grinding decline rather than an accelerating liquidation. The mixed intermediate pivot structure indicates countertrend swings within the broader decline, while both November short signals reinforce short-term bearish alignment. The next opposite-pivot threshold is 0.0064640. Resistance values above are transcribed from the Swing Pivots summary; they differ from the nearer resistance labels plotted on the chart. No news or seasonal catalyst is established by this image.
Chart Analysis ATS AI Generated: 2026-11-12 15:02 for Informational use only, not trading advice. Terms and Risk Disclosure Copyright © 2026. Algo Trading Systems LLC.