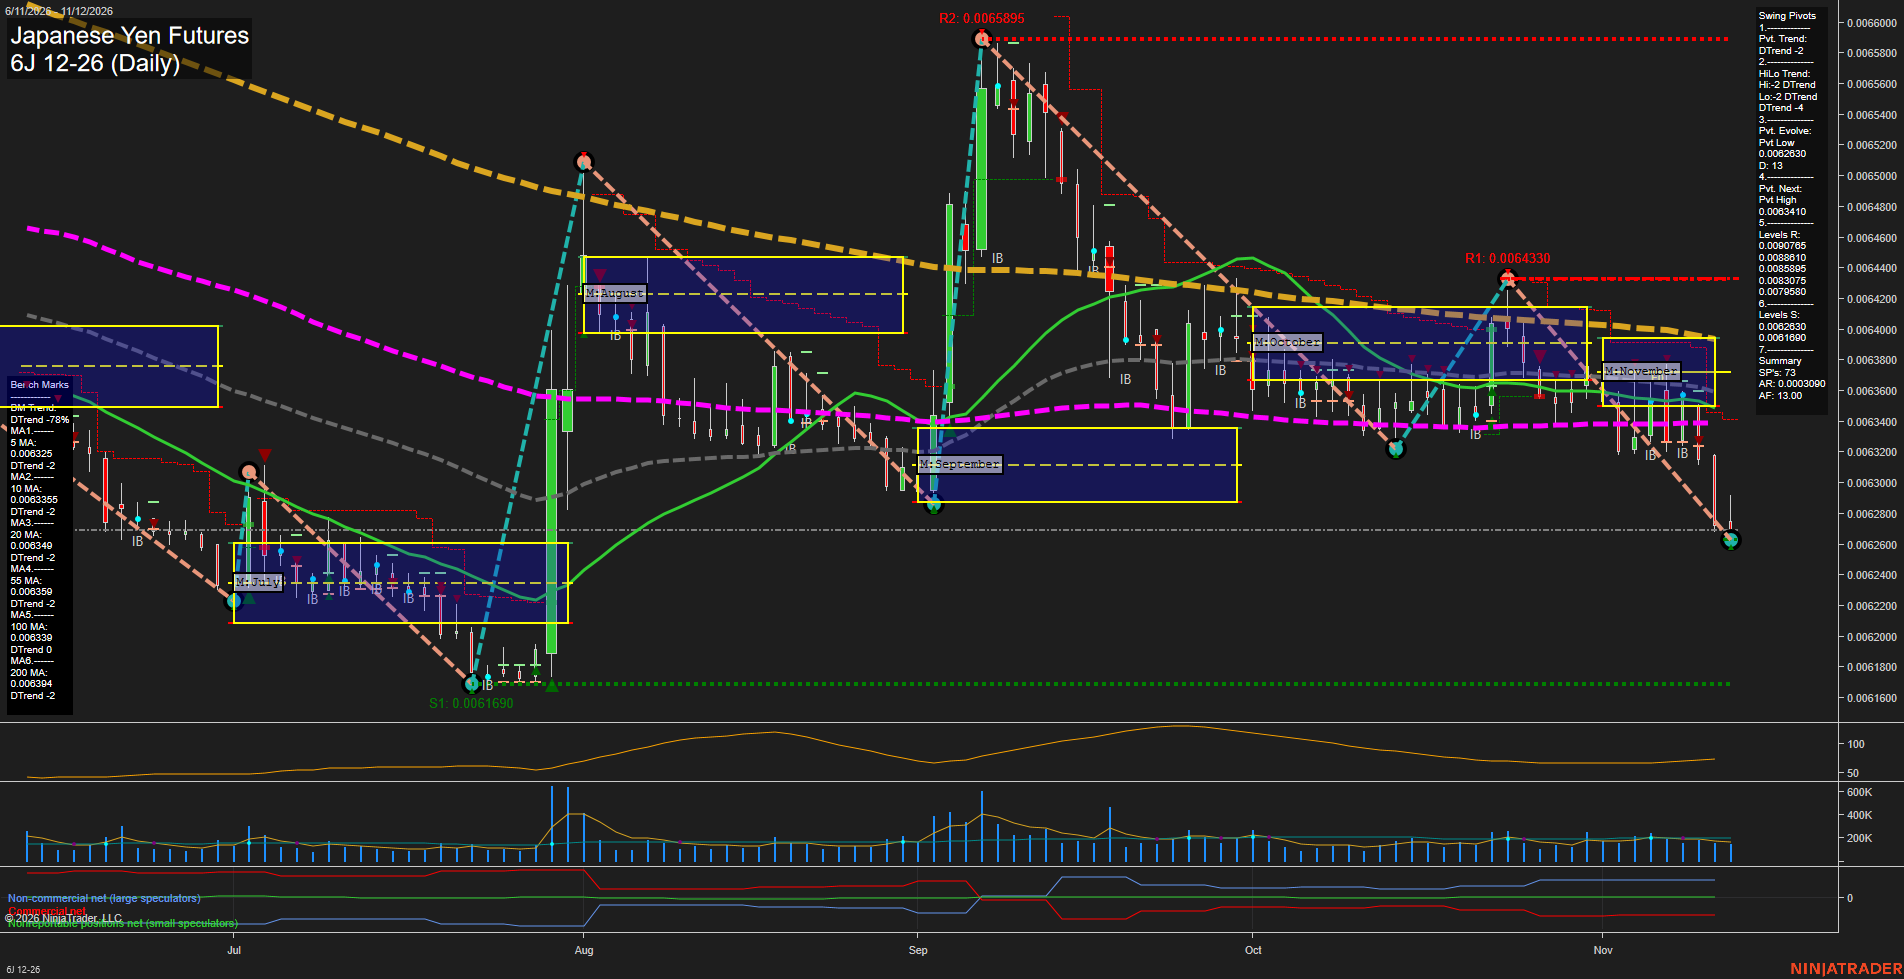
6J Japanese Yen Futures Daily Chart Analysis: 2026-Nov-12 15:01 CT
Price Action
- Last: Approximately 0.0062700,
- Bars: Large,
- Mom: Momentum fast.
WSFG Weekly
- Short-Term
- WSFG Current: -85%
- F0%/NTZ' Bias: Price Below,
- WSFG Trend: Down.
MSFG Month Nov
- Intermediate-Term
- MSFG Current: -46%
- F0%/NTZ' Bias: Price Below,
- MSFG Trend: Down.
YSFG Year 2026
- Long-Term
- YSFG Current: -27%
- F0%/NTZ' Bias: Price Below,
- YSFG Trend: Down.
Swing Pivots
- (Short-Term) 1. Pvt. Trend: DTrend,
- (Intermediate-Term) 2. HiLo Trend: DTrend,
- 3. Pvt. Evolve: Pvt low 0.0062630,
- 4. Pvt. Next: Pvt high 0.0063410,
- 5. Levels R: 0.0090765, 0.0088610, 0.0085895, 0.0083075, 0.0079580,
- 6. Levels S: 0.0062630, 0.0061690.
Daily Benchmarks
- (Short-Term) 5 Day: 0.006325 Down Trend,
- (Short-Term) 10 Day: 0.0063355 Down Trend,
- (Intermediate-Term) 20 Day: 0.006349 Down Trend,
- (Intermediate-Term) 55 Day: 0.006359 Down Trend,
- (Long-Term) 100 Day: 0.0063389 Down Trend,
- (Long-Term) 200 Day: 0.006394 Down Trend.
Additional Metrics
Recent Trade Signals
- 10 Nov 2026: Short 6J 12-26 @ 0.0063185 Signals.USAR-WSFG
- 10 Nov 2026: Short 6J 12-26 @ 0.0063185 Signals.USAR.TR120
Overall Rating
- Short-Term: Bearish,
- Intermediate-Term: Bearish,
- Long-Term: Bearish.
Key Insights Summary
The swing-trading picture is bearish across time frames. November's downside expansion has carried price beneath the monthly neutral zone and every benchmark average, extending the decline from October's 0.0064330 swing high. Lower highs and lower lows support trend continuation rather than a confirmed recovery. The evolving 0.0062630 pivot low marks the immediate support test, followed by 0.0061690; nearby chart resistance is 0.0064330, then 0.0065895, below the older resistance levels listed in the summary. The 0.0063410 next-pivot threshold defines the chart's potential short-term reversal transition, not an established reversal. Both November 10 short signals align with the current decline. The 100-day benchmark is essentially flat in the chart summary, although price remains below it; the falling 200-day average reinforces the broader bearish backdrop. ATR has edged higher, but volume does not show an obvious capitulation surge. No news catalyst or seasonal conclusion can be established from this chart alone.
Chart Analysis ATS AI Generated: 2026-11-12 15:01 for Informational use only, not trading advice. Terms and Risk Disclosure Copyright © 2026. Algo Trading Systems LLC.