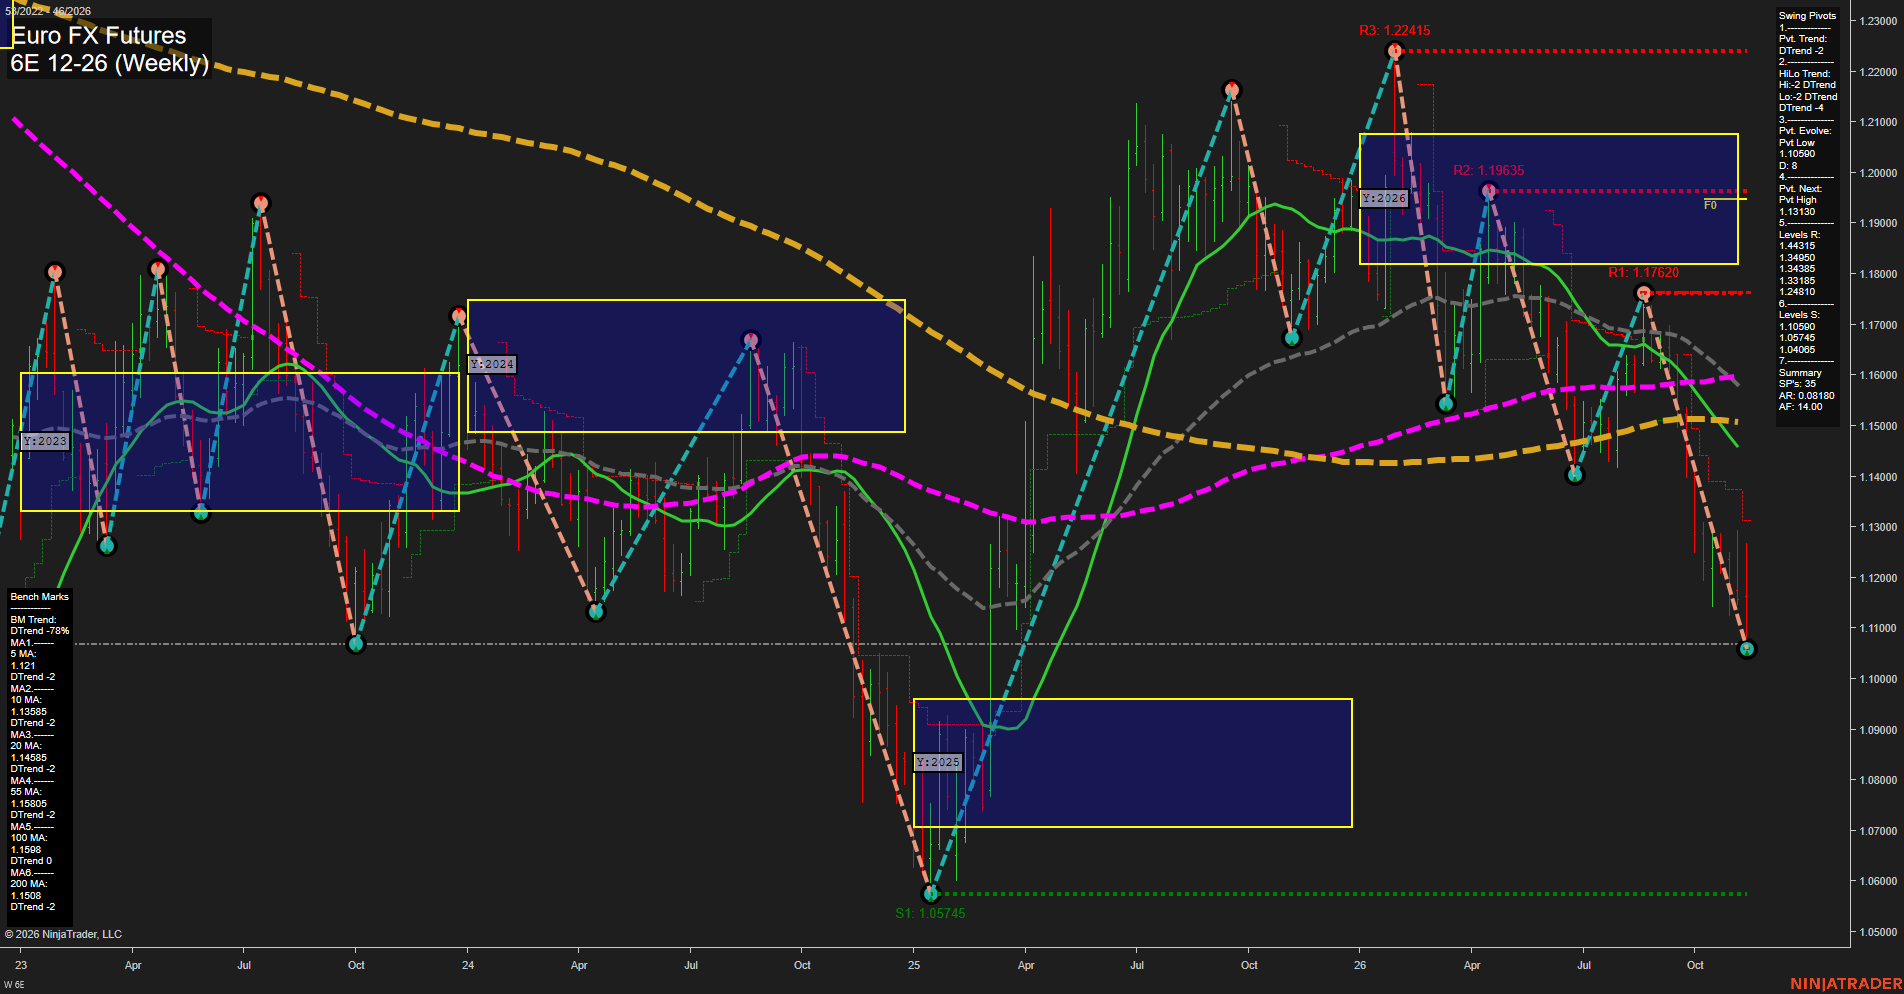
6E Euro FX Futures Weekly Chart Analysis: 2026-Nov-12 15:01 CT
Price Action
- Last: Approximately 1.1070; exact price marker not visible,
- Bars: Large,
- Mom: Momentum fast.
WSFG Weekly
- Short-Term
- WSFG Current: -74%
- F0%/NTZ' Bias: Price Below,
- WSFG Trend: Down.
MSFG Month Nov
- Intermediate-Term
- MSFG Current: -42%
- F0%/NTZ' Bias: Price Below,
- MSFG Trend: Down.
YSFG Year 2026
- Long-Term
- YSFG Current: -68%
- F0%/NTZ' Bias: Price Below,
- YSFG Trend: Down.
Swing Pivots
- (Short-Term) 1. Pvt. Trend: DTrend,
- (Intermediate-Term) 2. HiLo Trend: DTrend,
- 3. Pvt. Evolve: Pvt low 1.10590,
- 4. Pvt. Next: Pvt high 1.13130,
- 5. Levels R: 1.44315, 1.34950, 1.34385, 1.33185, 1.24810,
- 6. Levels S: 1.10590, 1.05745, 1.04065.
Weekly Benchmarks
- (Short-Term) 5 Day: 1.12100 Down Trend,
- (Short-Term) 10 Day: 1.13585 Down Trend,
- (Intermediate-Term) 20 Day: 1.14585 Down Trend,
- (Intermediate-Term) 55 Day: 1.15805 Down Trend,
- (Long-Term) 100 Day: 1.15980 Flat Trend,
- (Long-Term) 200 Day: 1.15080 Down Trend.
Recent Trade Signals
- 11 Nov 2026: Short 6E 12-26 @ 1.1147 Signals.USAR-WSFG
- 11 Nov 2026: Short 6E 12-26 @ 1.1147 Signals.USAR-MSFG
- 10 Nov 2026: Short 6E 12-26 @ 1.11675 Signals.USAR.TR120
Overall Rating
- Short-Term: Bearish,
- Intermediate-Term: Bearish,
- Long-Term: Bearish.
Key Insights Summary
The weekly structure shows a sustained selloff rather than sideways consolidation. Successively lower swing highs at 1.22415, 1.19635 and 1.17620 accompany a developing low at 1.10590, confirming bearish short- and intermediate-term pivot trends. Price is below all six benchmarks and the 2026 yearly neutral zone, with weekly, monthly and yearly grids aligned downward. Recent short signals reinforce that alignment. The evolving low is testing the vicinity of the late-2023 trough; the summary lists lower support at 1.05745 and 1.04065. The next-pivot reversal threshold is 1.13130, while the declining benchmarks describe substantial overhead resistance. The flat 100-period benchmark is the principal exception to otherwise declining averages. No long-term TR720 signal, news catalyst or seasonal evidence is supplied, so those factors cannot independently confirm the bearish technical reading.
Chart Analysis ATS AI Generated: 2026-11-12 15:01 for Informational use only, not trading advice. Terms and Risk Disclosure Copyright © 2026. Algo Trading Systems LLC.