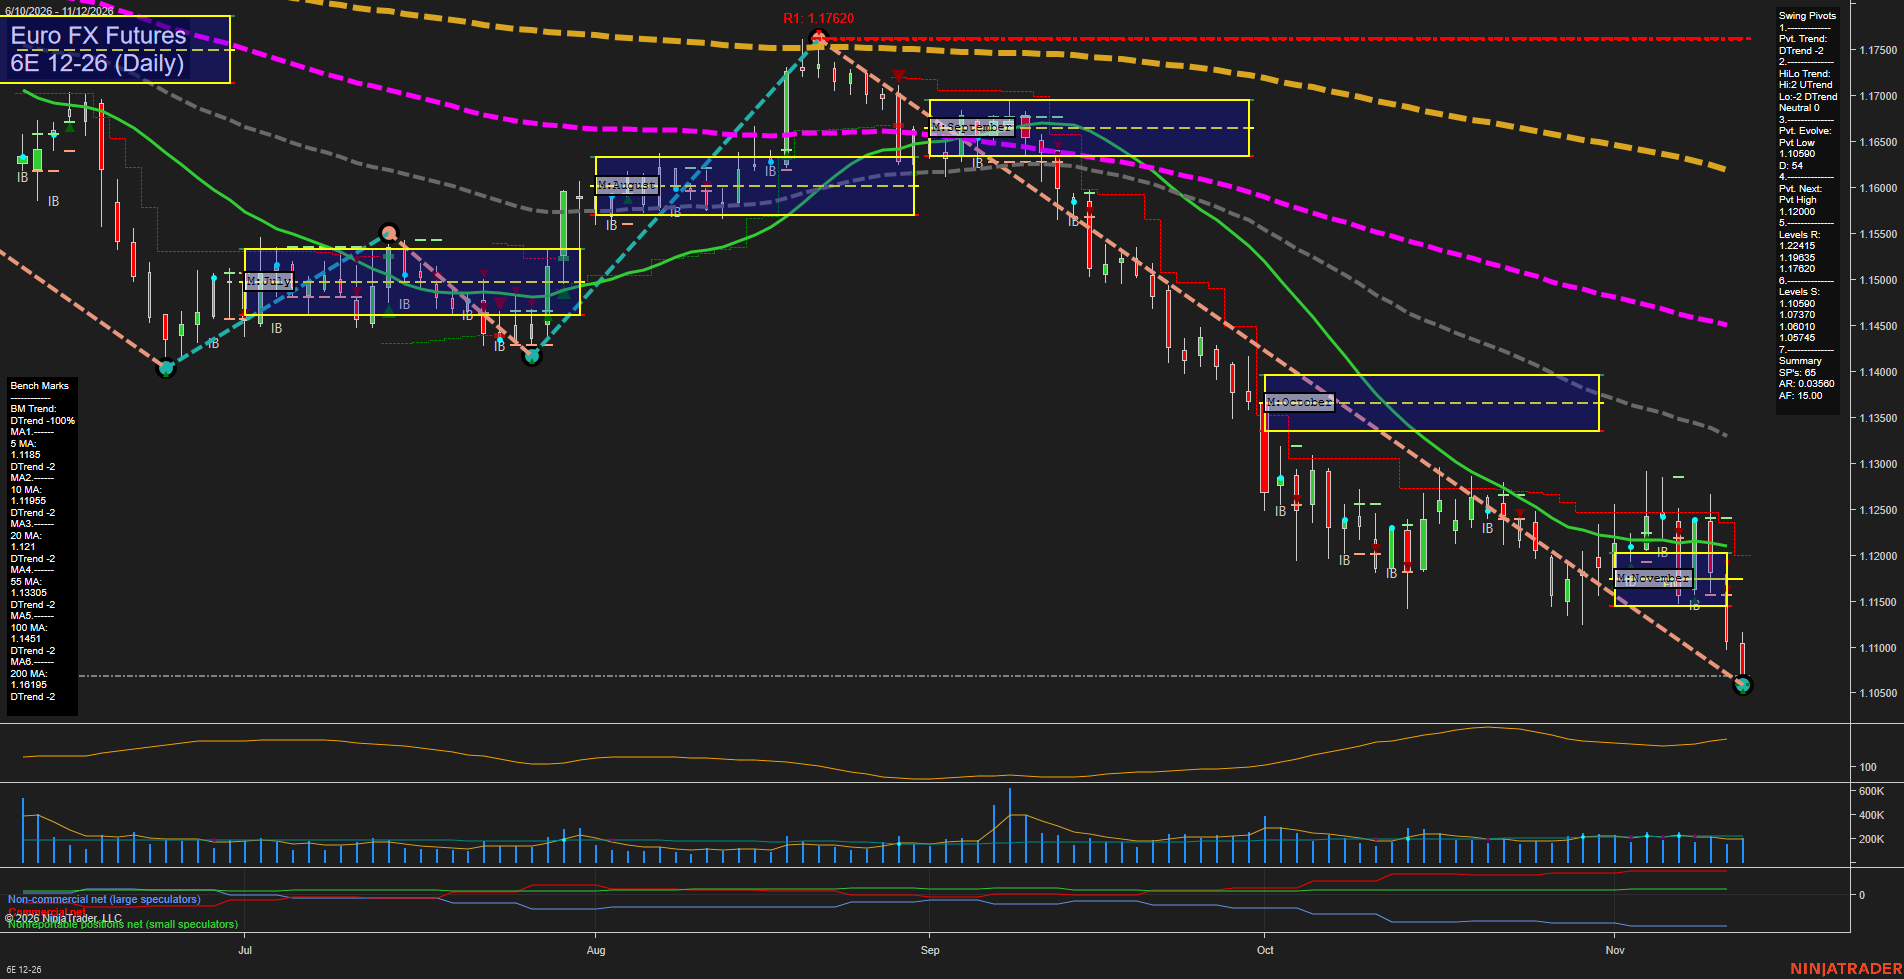
6E Euro FX Futures Daily Chart Analysis: 2026-Nov-12 15:01 CT
Price Action
- Last: Approximately 1.10690,
- Bars: Large,
- Mom: Momentum fast.
WSFG Weekly
- Short-Term
- WSFG Current: -74%
- F0%/NTZ' Bias: Price Below,
- WSFG Trend: Down.
MSFG Month Nov
- Intermediate-Term
- MSFG Current: -42%
- F0%/NTZ' Bias: Price Below,
- MSFG Trend: Down.
YSFG Year 2026
- Long-Term
- YSFG Current: -68%
- F0%/NTZ' Bias: Price Below,
- YSFG Trend: Down.
Swing Pivots
- (Short-Term) 1. Pvt. Trend: DTrend,
- (Intermediate-Term) 2. HiLo Trend: Neutral, high pivots UTrend and low pivots DTrend,
- 3. Pvt. Evolve: Pvt low 1.10590,
- 4. Pvt. Next: Pvt high 1.12000,
- 5. Levels R: 1.22415, 1.19635, 1.17620,
- 6. Levels S: 1.10590, 1.07370, 1.06010, 1.05745.
Daily Benchmarks
- (Short-Term) 5 Day: 1.11850 Down Trend,
- (Short-Term) 10 Day: 1.11955 Down Trend,
- (Intermediate-Term) 20 Day: 1.12100 Down Trend,
- (Intermediate-Term) 55 Day: 1.13805 Down Trend,
- (Long-Term) 100 Day: 1.14451 Down Trend,
- (Long-Term) 200 Day: 1.16195 Down Trend.
Additional Metrics
Recent Trade Signals
- 11 Nov 2026: Short 6E 12-26 @ 1.1147 Signals.USAR-WSFG
- 11 Nov 2026: Short 6E 12-26 @ 1.1147 Signals.USAR-MSFG
- 10 Nov 2026: Short 6E 12-26 @ 1.11675 Signals.USAR.TR120
Overall Rating
- Short-Term: Bearish,
- Intermediate-Term: Bearish,
- Long-Term: Bearish.
Key Insights Summary
From a futures swing-trading perspective, the dominant feature is bearish continuation following the breakdown from November consolidation. The latest large bearish candle closes near the developing 1.10590 swing low, with selling momentum accelerating after the early-November bounce failed beneath declining benchmarks. Price remains below all six moving averages and the weekly, monthly, and yearly neutral zones, reinforcing downside alignment across time horizons. The pivot summary nevertheless shows a neutral intermediate HiLo structure rather than a fully confirmed downtrend in both pivot categories. The 1.12000 next-pivot threshold sits near the short-term moving-average cluster, while 1.10590 is the immediate charted support. Recent short signals agree with the breakdown; no long-term TR720 signal is supplied. ATR has turned higher recently, but volume does not show an obvious exceptional breakout surge. News catalysts and seasonal effects cannot be established from this chart alone.
Chart Analysis ATS AI Generated: 2026-11-12 15:01 for Informational use only, not trading advice. Terms and Risk Disclosure Copyright © 2026. Algo Trading Systems LLC.