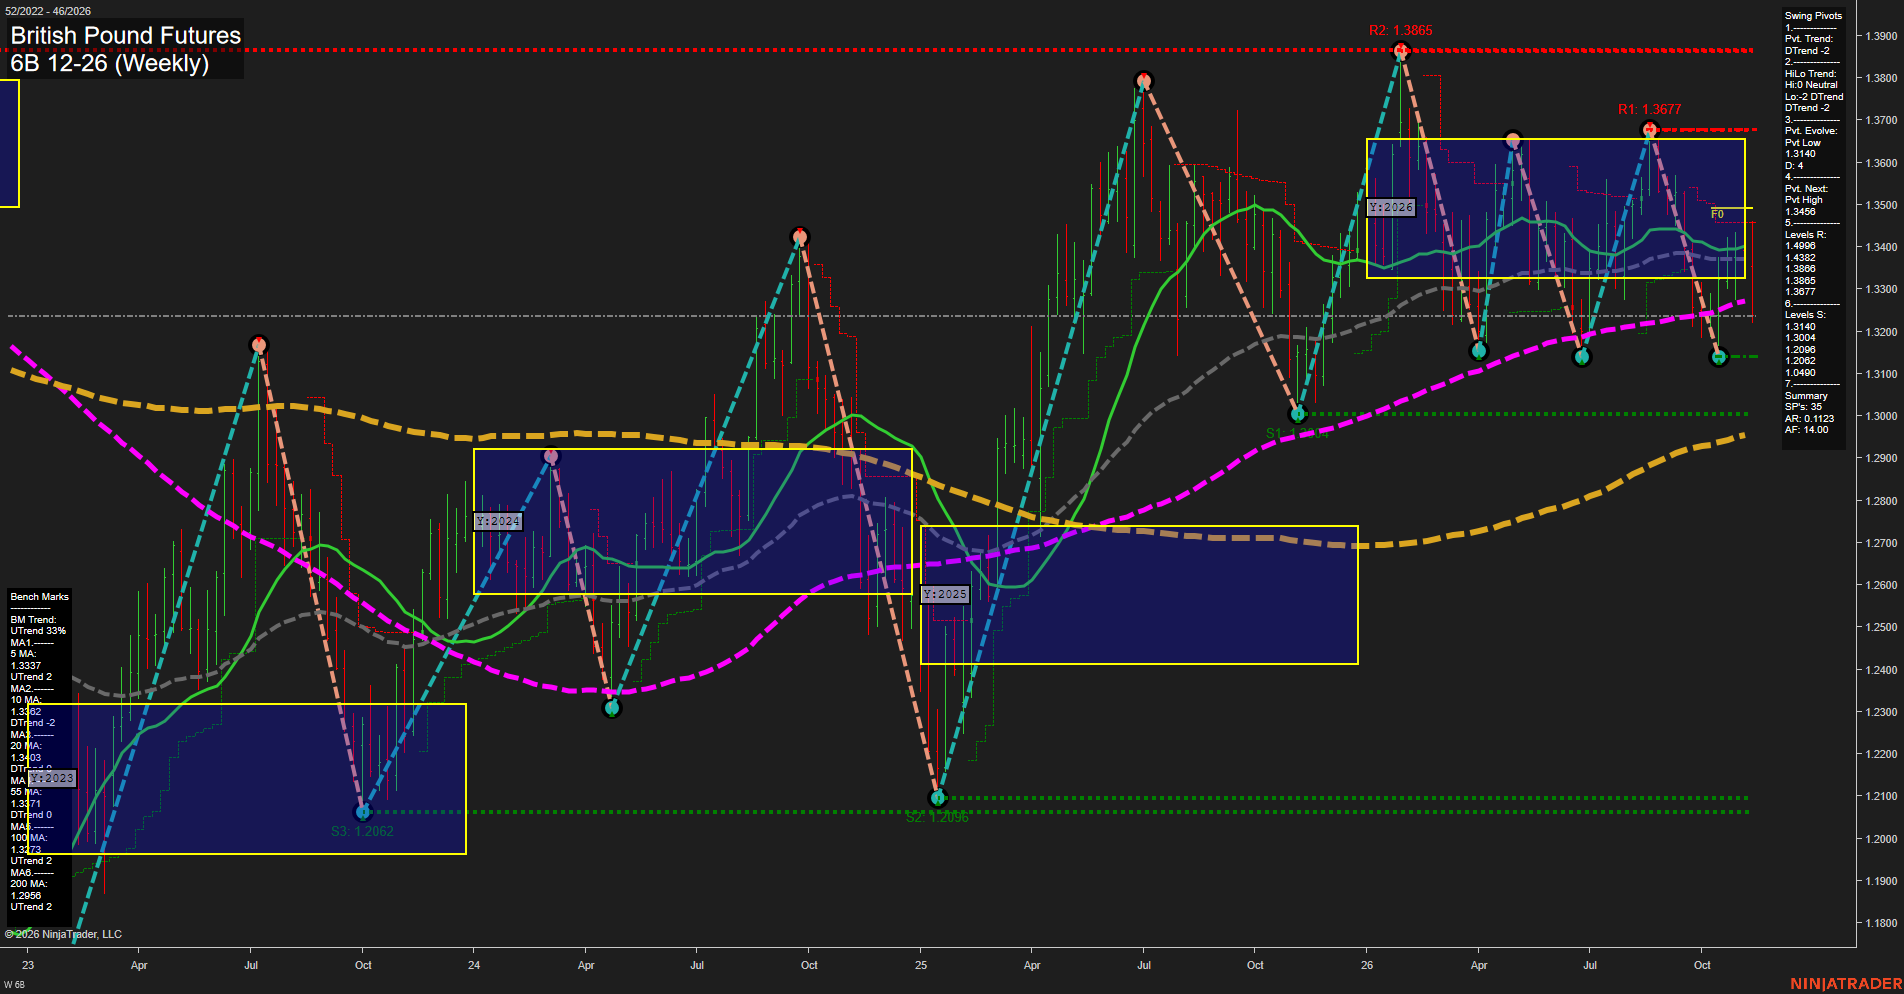
6B British Pound Futures Weekly Chart Analysis: 2026-Nov-12 15:00 CT
Price Action
- Last: Approximately 1.3238; black price marker not legible,
- Bars: Medium,
- Mom: Momentum slow.
WSFG Weekly
- Short-Term
- WSFG Current: -67%
- F0%/NTZ' Bias: Price Below,
- WSFG Trend: Down.
MSFG Month Nov
- Intermediate-Term
- MSFG Current: -51%
- F0%/NTZ' Bias: Price Below,
- MSFG Trend: Down.
YSFG Year 2026
- Long-Term
- YSFG Current: -15%
- F0%/NTZ' Bias: Price Below,
- YSFG Trend: Down.
Swing Pivots
- (Short-Term) 1. Pvt. Trend: DTrend,
- (Intermediate-Term) 2. HiLo Trend: DTrend,
- 3. Pvt. Evolve: Pvt low 1.3140,
- 4. Pvt. Next: Pvt high 1.3456,
- 5. Levels R: 1.4996, 1.4382, 1.3866, 1.3865, 1.3677,
- 6. Levels S: 1.3140, 1.3004, 1.2096, 1.2062, 1.0490.
Weekly Benchmarks
- (Short-Term) 5 Day: 1.3337 Up Trend,
- (Short-Term) 10 Day: 1.3362 Down Trend,
- (Intermediate-Term) 20 Day: 1.3403 Down Trend,
- (Intermediate-Term) 55 Day: 1.3371 Down Trend,
- (Long-Term) 100 Day: 1.3273 Up Trend,
- (Long-Term) 200 Day: 1.2956 Up Trend.
Recent Trade Signals
- 11 Nov 2026: Short 6B 12-26 @ 1.3331 Signals.USAR-WSFG
- 11 Nov 2026: Short 6B 12-26 @ 1.3336 Signals.USAR-MSFG
- 10 Nov 2026: Short 6B 12-26 @ 1.3321 Signals.USAR.TR120
- 10 Nov 2026: Short 6B 12-26 @ 1.3321 Signals.USAR.TR720
Overall Rating
- Short-Term: Bearish,
- Intermediate-Term: Bearish,
- Long-Term: Neutral.
Key Insights Summary
From a futures swing-trading perspective, the chart shows a bearish downswing within a broader, mixed long-term structure. Successively lower swing highs and lows, downward weekly and monthly grids, and four recent short signals reinforce the near-term downside bias. The rebound from 1.3140 has not reversed the pivot trend; the summary identifies 1.3456 as the next opposite-pivot threshold. Price remains below the clustered shorter and intermediate benchmarks and beneath the yearly neutral zone, suggesting an incomplete recovery rather than an established bullish reversal. Support is concentrated at 1.3140 and 1.3004, while 1.3677 is the nearest listed swing resistance. Rising 100- and 200-period benchmarks temper the bearish long-term grid and TR720 signal, leaving the broader outlook mixed. The chart alone does not establish news catalysts or a reliable seasonal influence.
Chart Analysis ATS AI Generated: 2026-11-12 15:01 for Informational use only, not trading advice. Terms and Risk Disclosure Copyright © 2026. Algo Trading Systems LLC.