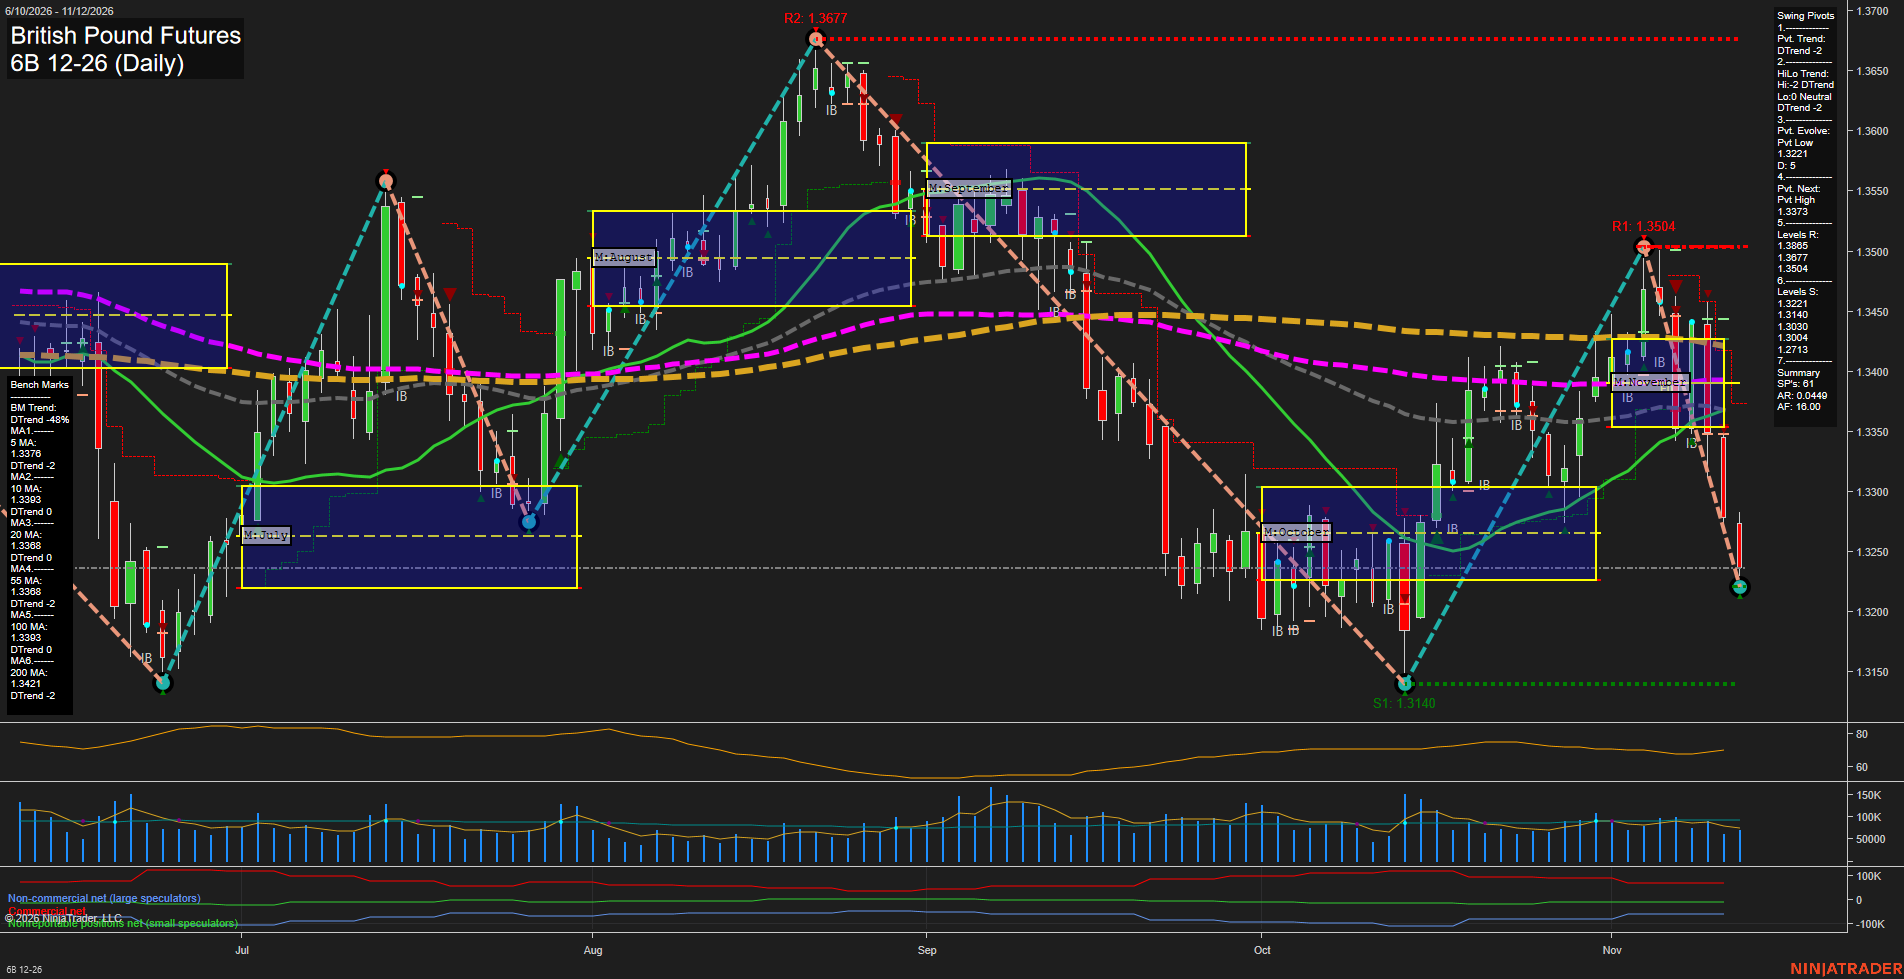
6B British Pound Futures Daily Chart Analysis: 2026-Nov-12 15:00 CT
Price Action
- Last: 1.3236,
- Bars: Large,
- Mom: Momentum fast.
WSFG Weekly
- Short-Term
- WSFG Current: -67%
- F0%/NTZ' Bias: Price Below,
- WSFG Trend: Down.
MSFG Month Nov
- Intermediate-Term
- MSFG Current: -51%
- F0%/NTZ' Bias: Price Below,
- MSFG Trend: Down.
YSFG Year 2026
- Long-Term
- YSFG Current: -15%
- F0%/NTZ' Bias: Price Below,
- YSFG Trend: Down.
Swing Pivots
- (Short-Term) 1. Pvt. Trend: DTrend,
- (Intermediate-Term) 2. HiLo Trend: DTrend,
- 3. Pvt. Evolve: Pvt low 1.3221,
- 4. Pvt. Next: Pvt high 1.3373,
- 5. Levels R: 1.3865, 1.3677, 1.3504,
- 6. Levels S: 1.3221, 1.3140, 1.3030, 1.3004, 1.2713.
Daily Benchmarks
- (Short-Term) 5 Day: 1.3376 Down Trend,
- (Short-Term) 10 Day: 1.3393 Down Trend,
- (Intermediate-Term) 20 Day: 1.3368 Down Trend,
- (Intermediate-Term) 55 Day: 1.3368 Down Trend,
- (Long-Term) 100 Day: 1.3393 Down Trend,
- (Long-Term) 200 Day: 1.3421 Down Trend.
Additional Metrics
Recent Trade Signals
- 11 Nov 2026: Short 6B 12-26 @ 1.3331 Signals.USAR-WSFG
- 11 Nov 2026: Short 6B 12-26 @ 1.3336 Signals.USAR-MSFG
- 10 Nov 2026: Short 6B 12-26 @ 1.3321 Signals.USAR.TR120
- 10 Nov 2026: Short 6B 12-26 @ 1.3321 Signals.USAR.TR720
Overall Rating
- Short-Term: Bearish,
- Intermediate-Term: Bearish,
- Long-Term: Bearish.
Key Insights Summary
The November rally reversed from 1.3504, establishing a lower swing high beneath August's 1.3677 peak. Large bearish bars and accelerating downside momentum have carried price below all six benchmarks and the November neutral zone. Weekly, monthly and yearly grid readings align with the bearish pivot trends and recent short signals across time horizons. The evolving 1.3221 pivot low remains above October's 1.3140 support, so the broader structure combines lower highs with an unresolved higher low rather than a confirmed fresh breakdown beneath October. The 1.3368–1.3421 benchmark cluster now sits overhead, while 1.3373 is the summary's next opposite-pivot reversal threshold. ATR of 68 contrasts with the sharp recent decline, indicating concentrated directional movement rather than an exceptional sustained expansion in average volatility. News catalysts and seasonal influences cannot be established from the chart alone.
Chart Analysis ATS AI Generated: 2026-11-12 15:00 for Informational use only, not trading advice. Terms and Risk Disclosure Copyright © 2026. Algo Trading Systems LLC.