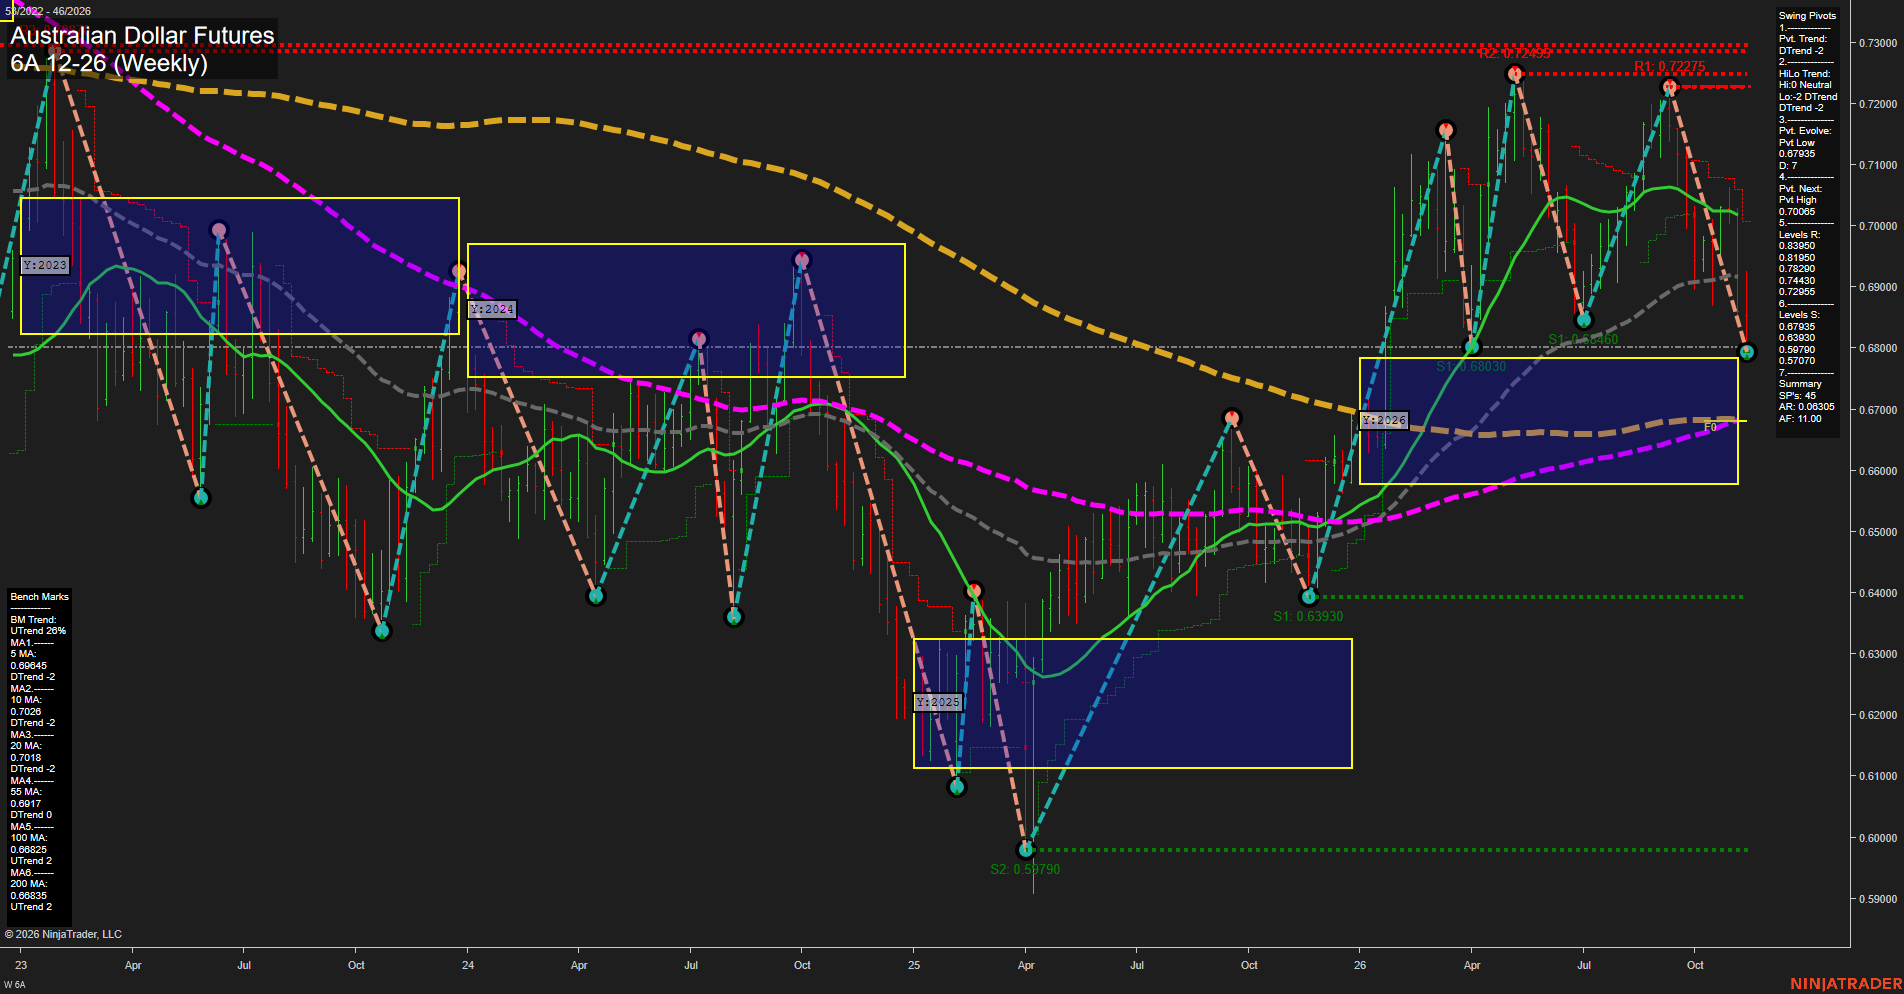
6A Australian Dollar Futures Weekly Chart Analysis: 2026-Nov-12 15:00 CT
Price Action
- Last: Approximately 0.6800; exact black price marker not visible,
- Bars: Large,
- Mom: Momentum fast.
WSFG Weekly
- Short-Term
- WSFG Current: -46%
- F0%/NTZ' Bias: Price Below,
- WSFG Trend: Down.
MSFG Month Nov
- Intermediate-Term
- MSFG Current: -103%
- F0%/NTZ' Bias: Price Below,
- MSFG Trend: Down.
YSFG Year 2026
- Long-Term
- YSFG Current: 12%
- F0%/NTZ' Bias: Price Above,
- YSFG Trend: Up.
Swing Pivots
- (Short-Term) 1. Pvt. Trend: DTrend,
- (Intermediate-Term) 2. HiLo Trend: DTrend,
- 3. Pvt. Evolve: Pvt low 0.67935,
- 4. Pvt. Next: Pvt high 0.70065,
- 5. Levels R: 0.83950, 0.81950, 0.78290, 0.74430, 0.72955,
- 6. Levels S: 0.67935, 0.63930, 0.59790, 0.57070.
Weekly Benchmarks
- (Short-Term) 5 Day: 0.69645 Down Trend,
- (Short-Term) 10 Day: 0.70260 Down Trend,
- (Intermediate-Term) 20 Day: 0.70180 Down Trend,
- (Intermediate-Term) 55 Day: 0.69170 Down Trend,
- (Long-Term) 100 Day: 0.66825 Up Trend,
- (Long-Term) 200 Day: 0.66835 Up Trend.
Recent Trade Signals
- 11 Nov 2026: Short 6A 12-26 @ 0.6841 Signals.USAR-WSFG
- 10 Nov 2026: Short 6A 12-26 @ 0.68435 Signals.USAR.TR120
Overall Rating
- Short-Term: Bearish,
- Intermediate-Term: Bearish,
- Long-Term: Bullish.
Key Insights Summary
The weekly structure shows a forceful downswing from the lower high near 0.72275, following the earlier peak near 0.72495. Price has broken beneath the prior 0.68460 and 0.68030 swing lows, with the evolving low now at 0.67935. Falling short- and intermediate-term benchmarks, downward pivot trends, negative weekly and monthly grids, and both recent short signals reinforce the bearish swing picture. The longer-term backdrop remains bullish by the specified metrics: price remains above the yearly F0% and the rising 100- and 200-period benchmarks clustered near 0.6683. This creates a bearish short- and intermediate-term retracement within a still-positive longer-term framework. The 0.70065 next-pivot threshold marks the chart's stated reversal reference, not a confirmed reversal. News catalysts and seasonal influences cannot be established from this chart alone.
Chart Analysis ATS AI Generated: 2026-11-12 15:00 for Informational use only, not trading advice. Terms and Risk Disclosure Copyright © 2026. Algo Trading Systems LLC.