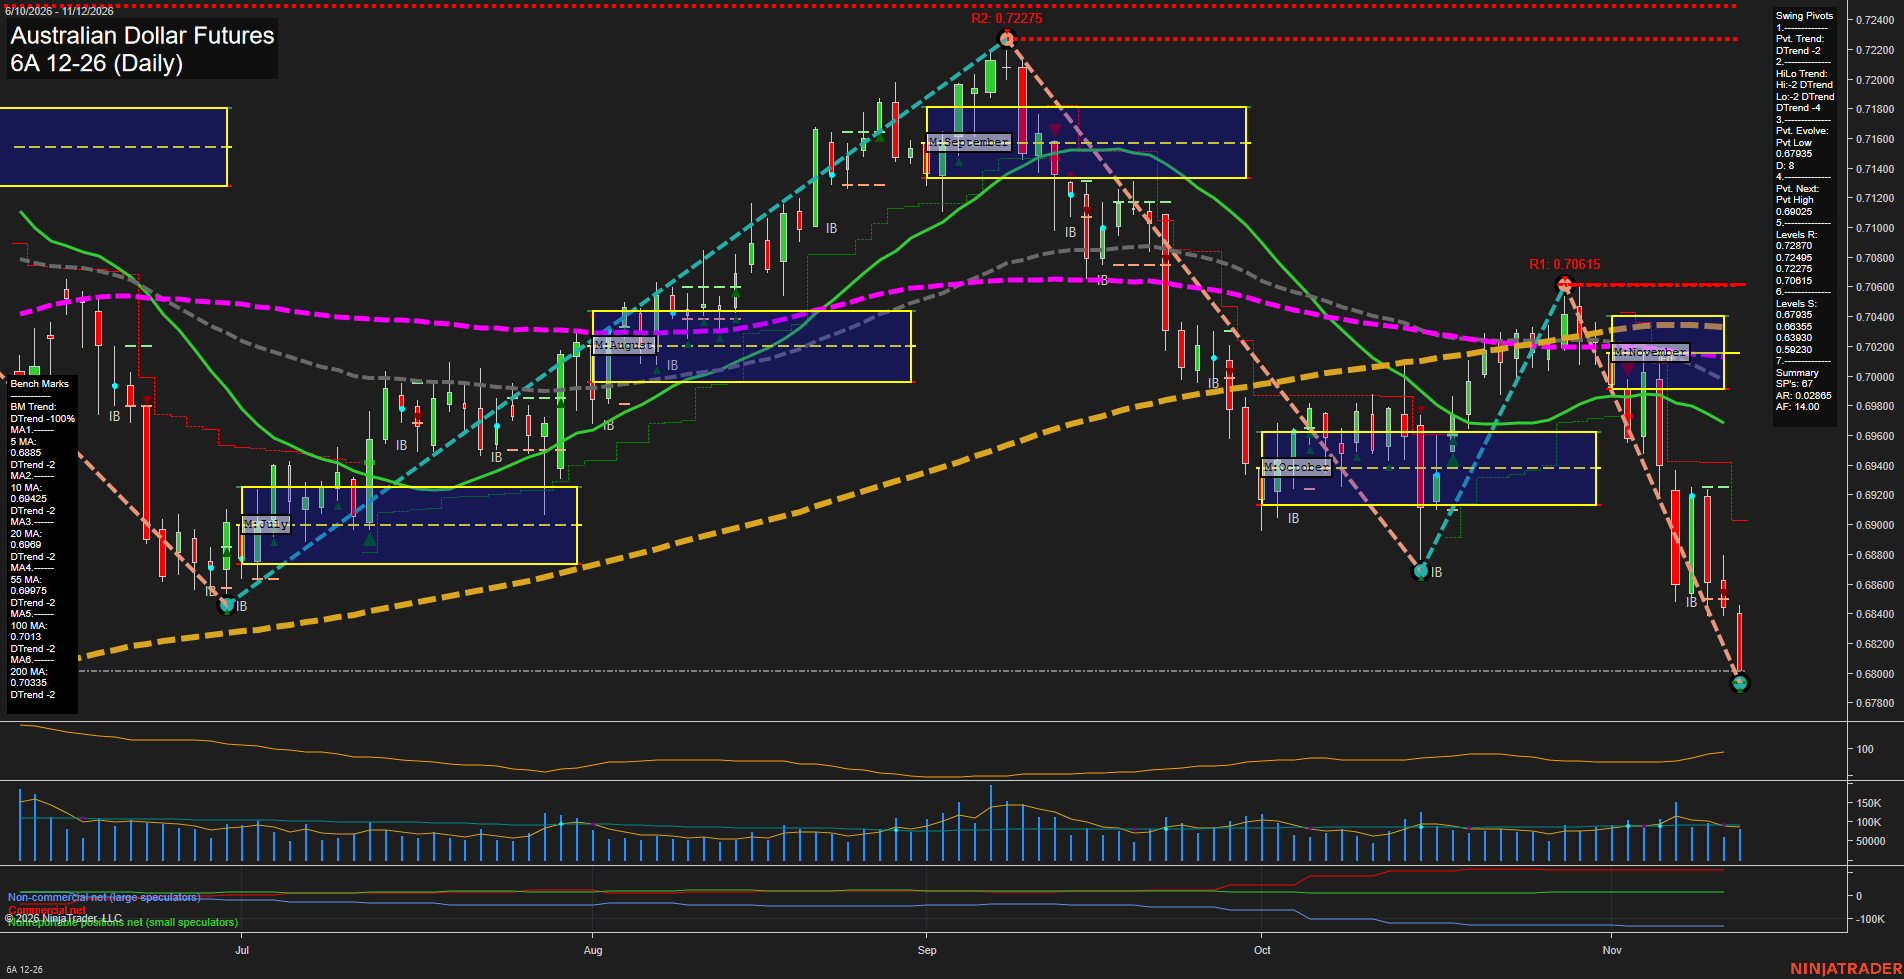
6A Australian Dollar Futures Daily Chart Analysis: 2026-Nov-12 15:00 CT
Price Action
- Last: 0.68025,
- Bars: Large,
- Mom: Momentum fast.
WSFG Weekly
- Short-Term
- WSFG Current: -46%
- F0%/NTZ' Bias: Price Below,
- WSFG Trend: Down.
MSFG Month Nov
- Intermediate-Term
- MSFG Current: -103%
- F0%/NTZ' Bias: Price Below,
- MSFG Trend: Down.
YSFG Year 2026
- Long-Term
- YSFG Current: 12%
- F0%/NTZ' Bias: Price Above,
- YSFG Trend: Up.
Swing Pivots
- (Short-Term) 1. Pvt. Trend: DTrend,
- (Intermediate-Term) 2. HiLo Trend: DTrend,
- 3. Pvt. Evolve: Pvt low 0.67935,
- 4. Pvt. Next: Pvt high 0.69025,
- 5. Levels R: 0.72870, 0.72495, 0.72275, 0.70615,
- 6. Levels S: 0.67935, 0.66355, 0.63930, 0.59230.
Daily Benchmarks
- (Short-Term) 5 Day: 0.68850 Down Trend,
- (Short-Term) 10 Day: 0.69425 Down Trend,
- (Intermediate-Term) 20 Day: 0.69690 Down Trend,
- (Intermediate-Term) 55 Day: 0.69975 Down Trend,
- (Long-Term) 100 Day: 0.70130 Down Trend,
- (Long-Term) 200 Day: 0.70335 Down Trend.
Additional Metrics
Recent Trade Signals
- 11 Nov 2026: Short 6A 12-26 @ 0.6841 Signals.USAR-WSFG
- 10 Nov 2026: Short 6A 12-26 @ 0.68435 Signals.USAR.TR120
Overall Rating
- Short-Term: Bearish,
- Intermediate-Term: Bearish,
- Long-Term: Bearish.
Key Insights Summary
The swing structure favors bearish continuation following the late-October rebound failure at 0.70615, a lower high beneath September's 0.72275 peak. November's selloff has broken the October swing low and extended the evolving low to 0.67935, with large bearish bars and expanding daily ranges reflecting fast downside momentum. Price is below all six declining benchmarks and below the weekly and monthly neutral zones; both recent short signals align with that weakness. The 0.69025 next-pivot threshold defines the chart's potential short-term structural reversal, while 0.67935 is the immediate support reference. Long-term conditions are mixed beneath the bearish majority rating: the yearly grid remains positive, but both long-term benchmarks trend down. The chart alone does not establish a news or seasonal explanation for the decline.
Chart Analysis ATS AI Generated: 2026-11-12 15:00 for Informational use only, not trading advice. Terms and Risk Disclosure Copyright © 2026. Algo Trading Systems LLC.