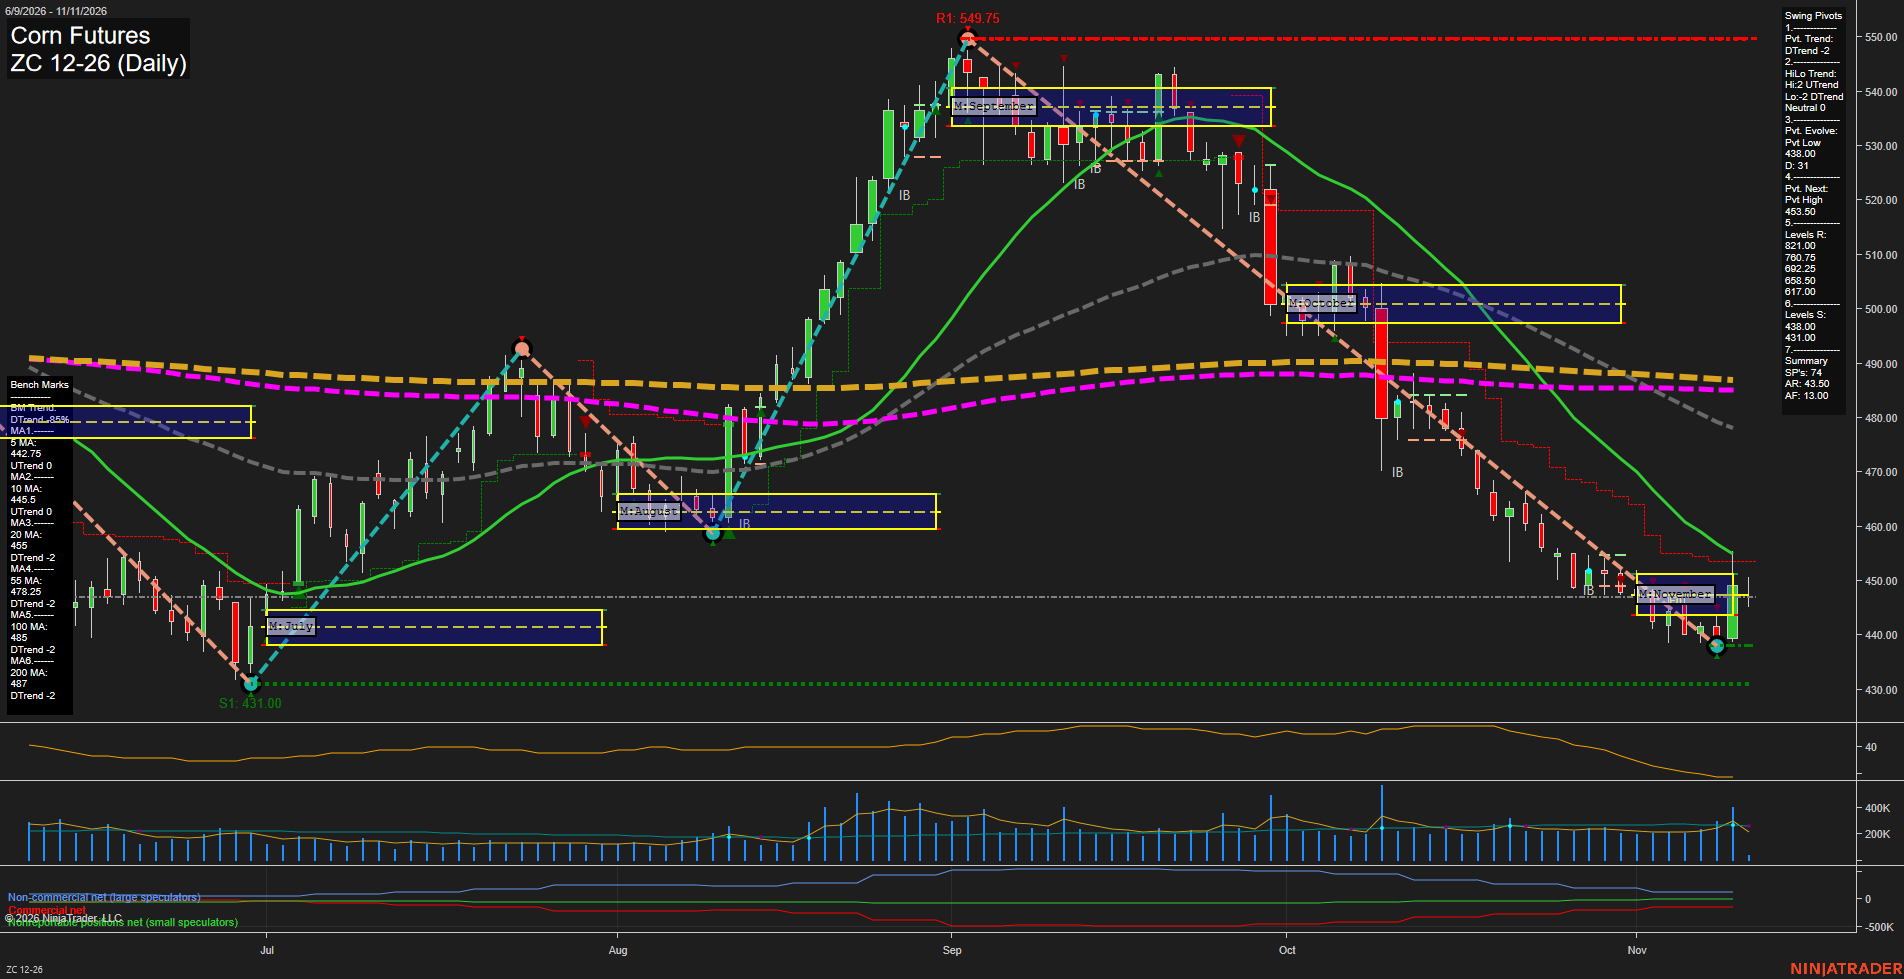
ZC Corn Futures Daily Chart Analysis: 2026-Nov-11 07:17 CT
Price Action
- Last: 438.00,
- Bars: Small,
- Mom: slow.
WSFG Weekly
- Short-Term
- WSFG Current: 35%
- F0%/NTZ' Bias: Price Above,
- WSFG Trend: Up.
MSFG Month Nov
- Intermediate-Term
- MSFG Current: -2%
- F0%/NTZ' Bias: Price Below,
- MSFG Trend: Down.
YSFG Year 2026
- Long-Term
- YSFG Current: -38%
- F0%/NTZ' Bias: Price Below,
- YSFG Trend: Down.
Swing Pivots
- (Short-Term) 1. Pvt. Trend: DTrend,
- (Intermediate-Term) 2. HiLo Trend: UTrend,
- 3. Pvt. Evolve: Pvt low 438.00,
- 4. Pvt. Next: Pvt high 453.50,
- 5. Levels R: 528.50, 517.00, 500.75, 492.25, 473.50,
- 6. Levels S: 438.00, 431.00.
Daily Benchmarks
- (Short-Term) 5 Day: 442.75 Up Trend,
- (Short-Term) 10 Day: 445.50 Up Trend,
- (Intermediate-Term) 20 Day: 455.00 Down Trend,
- (Intermediate-Term) 55 Day: 478.25 Down Trend,
- (Long-Term) 100 Day: 485.00 Down Trend,
- (Long-Term) 200 Day: 487.00 Down Trend.
Additional Metrics
Recent Trade Signals
- 10 Nov 2026: Short ZC 12-26 @ 440.75 Signals.USAR-MSFG
- 09 Nov 2026: Short ZC 12-26 @ 439.25 Signals.USAR-WSFG
Overall Rating
- Short-Term: Bearish,
- Intermediate-Term: Bearish,
- Long-Term: Bearish.
Key Insights Summary
Price remains in a broad daily decline from the September 549.75 pivot high, with successive lower highs and lower lows maintaining the bearish swing structure. The latest 438.00 pivot low sits directly at the November monthly grid area and above 431.00 structural support, producing small, compressed candles and slower momentum after the sharp October-November selloff. Weekly grid positioning is constructive and the 5- and 10-day benchmarks have turned higher, reflecting a short-term countertrend stabilization, while price remains below the declining 20-, 55-, 100-, and 200-day averages. The monthly and yearly grids remain below their F0% levels, keeping intermediate and long-term market structure aligned with the broader downtrend. A recovery through 453.50 would define the next pivot transition, while the 438.00 and 431.00 support area remains the key downside structure.
Chart Analysis ATS AI Generated: 2026-11-11 07:17 for Informational use only, not trading advice. Terms and Risk Disclosure Copyright © 2026. Algo Trading Systems LLC.