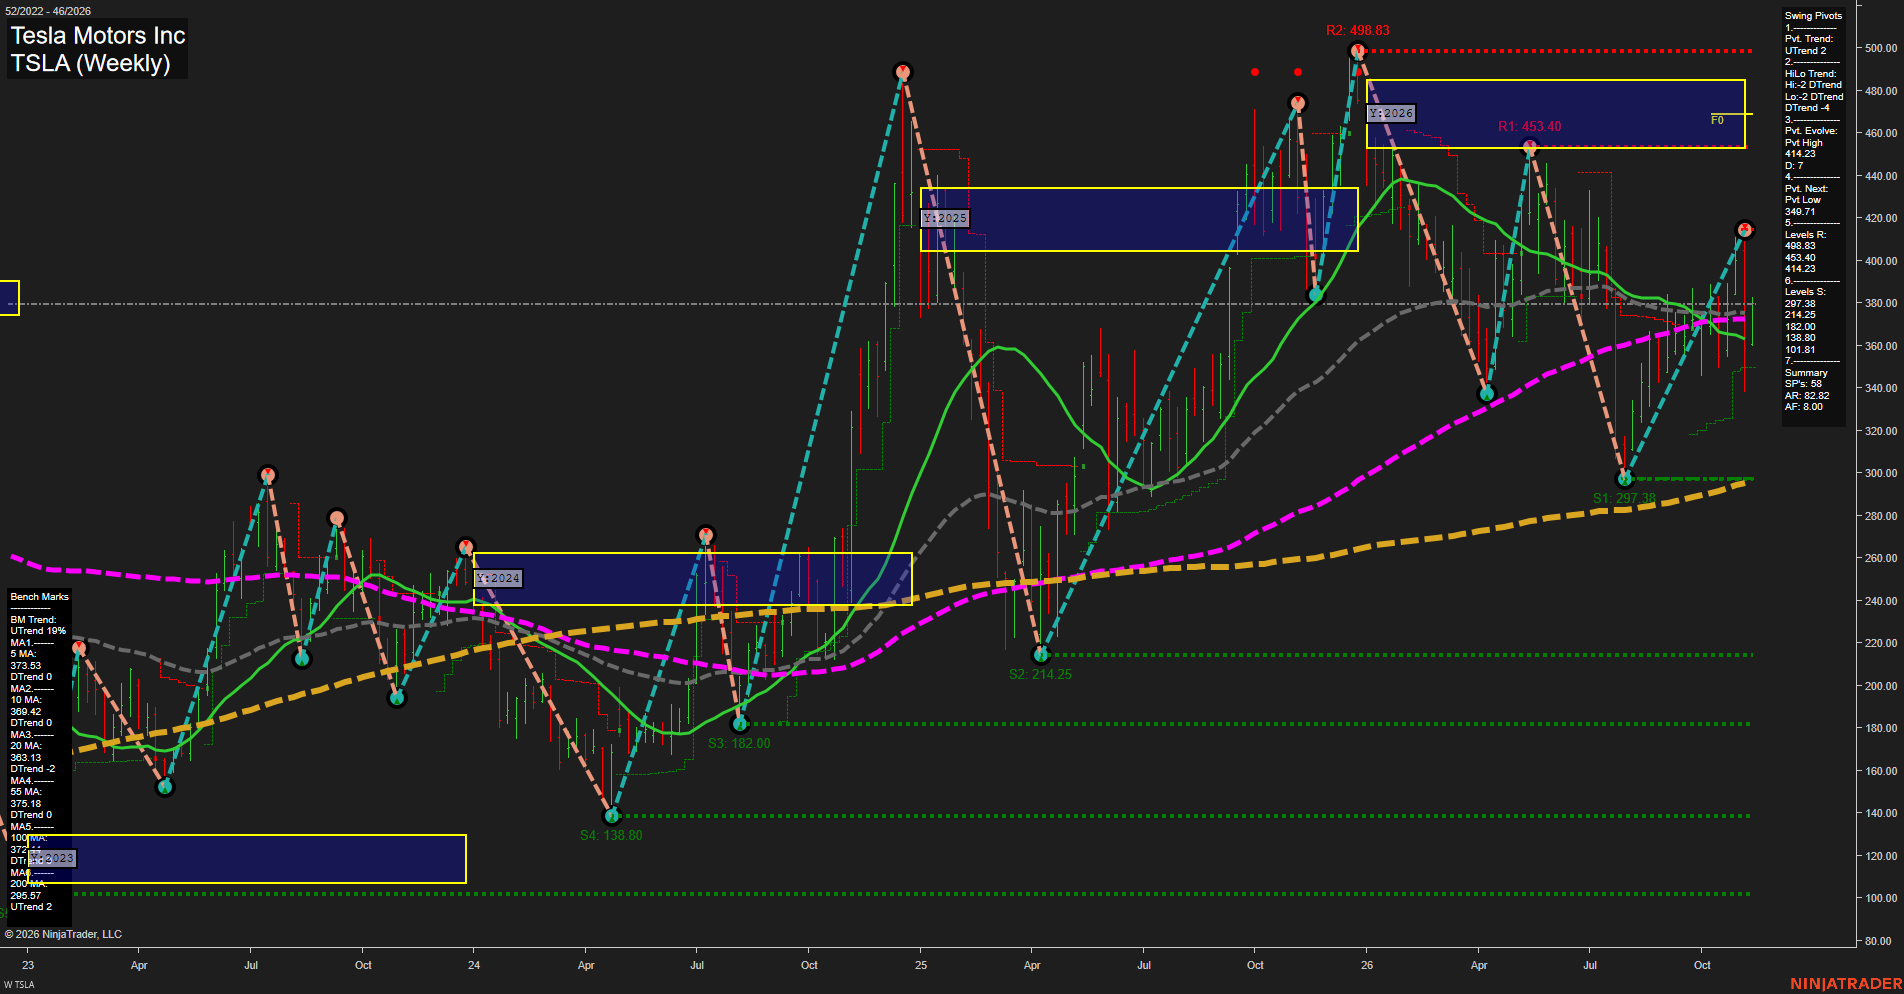
TSLA Tesla Motors Inc Weekly Chart Analysis: 2026-Nov-11 07:15 CT
Price Action
- Last: 379.00,
- Bars: Medium,
- Mom: Average.
WSFG Weekly
- Short-Term
- WSFG Current: NA%
- F0%/NTZ' Bias: Price Neutral,
- WSFG Trend: Neutral.
MSFG Month Nov
- Intermediate-Term
- MSFG Current: NA%
- F0%/NTZ' Bias: Price Bearish,
- MSFG Trend: Bearish.
YSFG Year 2026
- Long-Term
- YSFG Current: NA%
- F0%/NTZ' Bias: Price Bearish,
- YSFG Trend: Bearish.
Swing Pivots
- (Short-Term) 1. Pvt. Trend: DTrend,
- (Intermediate-Term) 2. HiLo Trend: DTrend,
- 3. Pvt. Evolve: Pvt high 414.23,
- 4. Pvt. Next: Pvt low 349.71,
- 5. Levels R: 498.83, 453.40, 414.23,
- 6. Levels S: 297.38, 214.25, 182.00, 138.80, 101.81.
Weekly Benchmarks
- (Short-Term) 5 Day: 373.43 Down Trend,
- (Short-Term) 10 Day: 369.42 Down Trend,
- (Intermediate-Term) 20 Day: 363.73 Down Trend,
- (Intermediate-Term) 55 Day: 375.18 Down Trend,
- (Long-Term) 100 Day: 372.00 Up Trend,
- (Long-Term) 200 Day: 295.57 Up Trend.
Overall Rating
- Short-Term: Bearish,
- Intermediate-Term: Bearish,
- Long-Term: Bullish.
Key Insights Summary
TSLA is in a sharp weekly recovery from the 297.38 pivot low, with price near 379.00 and holding above the 5-, 10-, 20-, 55-, and 100-period benchmarks. The active swing-pivot structure remains bearish, however, because the evolving pivot is the 414.23 swing high and the next downside reversal level is 349.71. The 414.23 level is the immediate structural ceiling, followed by 453.40 and the 2026 yearly-grid region near 460-485. The monthly and yearly Fib-grid positioning remains below their neutral-zone areas, describing the rally as a countertrend rebound within weaker intermediate structure. Longer-term trend conditions remain constructive because the 100- and 200-period averages are rising, while 297.38 remains the major weekly support reference.
Chart Analysis ATS AI Generated: 2026-11-11 07:15 for Informational use only, not trading advice. Terms and Risk Disclosure Copyright © 2026. Algo Trading Systems LLC.