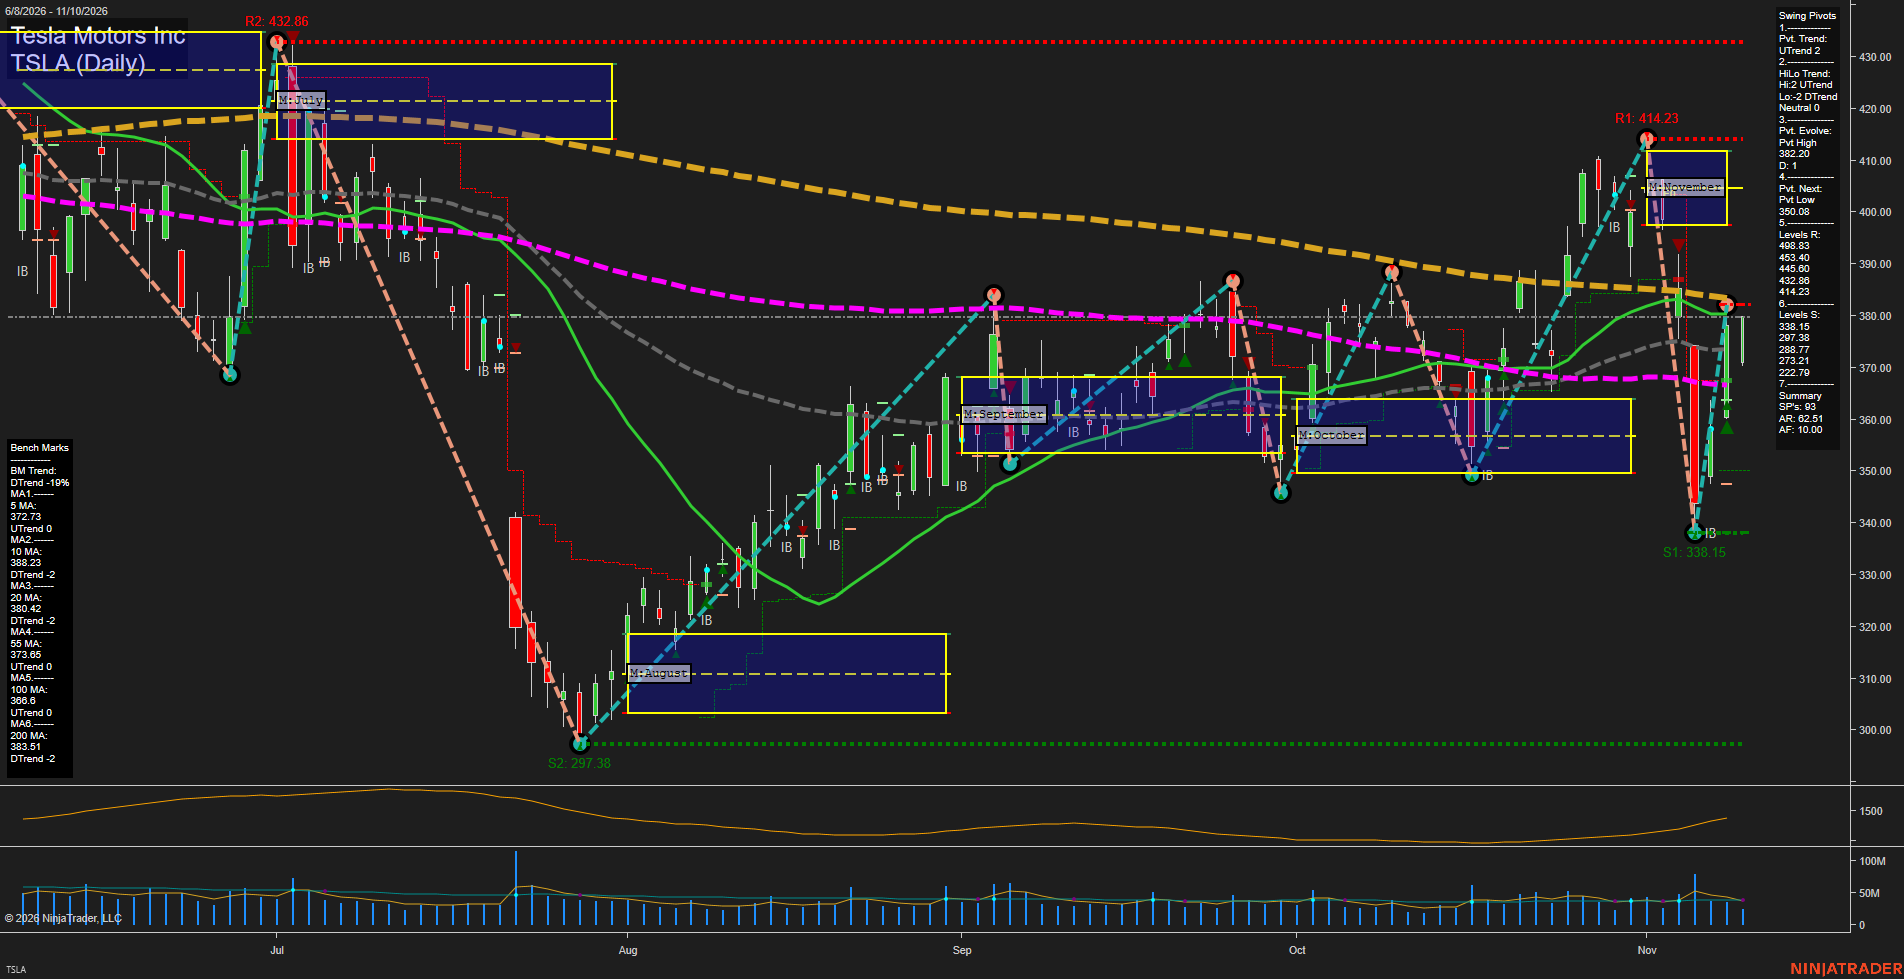
TSLA Tesla Motors Inc Daily Chart Analysis: 2026-Nov-11 07:14 CT
Price Action
- Last: 381.93,
- Bars: Medium,
- Mom: Fast.
WSFG Weekly
- Short-Term
- WSFG Current: NA%
- F0%/NTZ' Bias: Price Neutral,
- WSFG Trend: Neutral.
MSFG Month Nov
- Intermediate-Term
- MSFG Current: NA%
- F0%/NTZ' Bias: Price Below NTZ,
- MSFG Trend: Bearish.
YSFG Year 2026
- Long-Term
- YSFG Current: NA%
- F0%/NTZ' Bias: Price Neutral,
- YSFG Trend: Neutral.
Swing Pivots
- (Short-Term) 1. Pvt. Trend: UTrend,
- (Intermediate-Term) 2. HiLo Trend: UTrend,
- 3. Pvt. Evolve: Pvt high 382.20,
- 4. Pvt. Next: Pvt low 350.08,
- 5. Levels R: 498.33, 453.40, 445.60, 438.20, 414.23,
- 6. Levels S: 358.15, 339.15, 297.38, 288.77, 273.21, 222.79.
Daily Benchmarks
- (Short-Term) 5 Day: 372.73 Up Trend,
- (Short-Term) 10 Day: 388.23 Down Trend,
- (Intermediate-Term) 20 Day: 380.42 Down Trend,
- (Intermediate-Term) 55 Day: 373.05 Up Trend,
- (Long-Term) 100 Day: 368.00 Up Trend,
- (Long-Term) 200 Day: 383.51 Down Trend.
Additional Metrics
- ATR: 62.51,
- VOLMA: 40.00.
Overall Rating
- Short-Term: Neutral,
- Intermediate-Term: Neutral,
- Long-Term: Neutral.
Key Insights Summary
TSLA is showing a fast, medium-range rebound from the early-November 338 area swing low, lifting price back above the 5-day, 20-day, 55-day, and 100-day benchmarks. From a futures swing-trading perspective, the rebound has restored an UTrend pivot structure, but price remains marginally below the 10-day average, 200-day average, the 382.20 evolving pivot high, and the November NTZ area. This creates a mixed, high-volatility consolidation condition rather than a fully confirmed trend continuation. The 414.23 pivot resistance is the principal overhead structural level, while 358.15 and 339.15 are the nearest downside swing supports. ATR at 62.51 reflects an expanded daily movement regime, consistent with the sharp selloff-and-recovery sequence and choppy directional rotations.
Chart Analysis ATS AI Generated: 2026-11-11 07:15 for Informational use only, not trading advice. Terms and Risk Disclosure Copyright © 2026. Algo Trading Systems LLC.