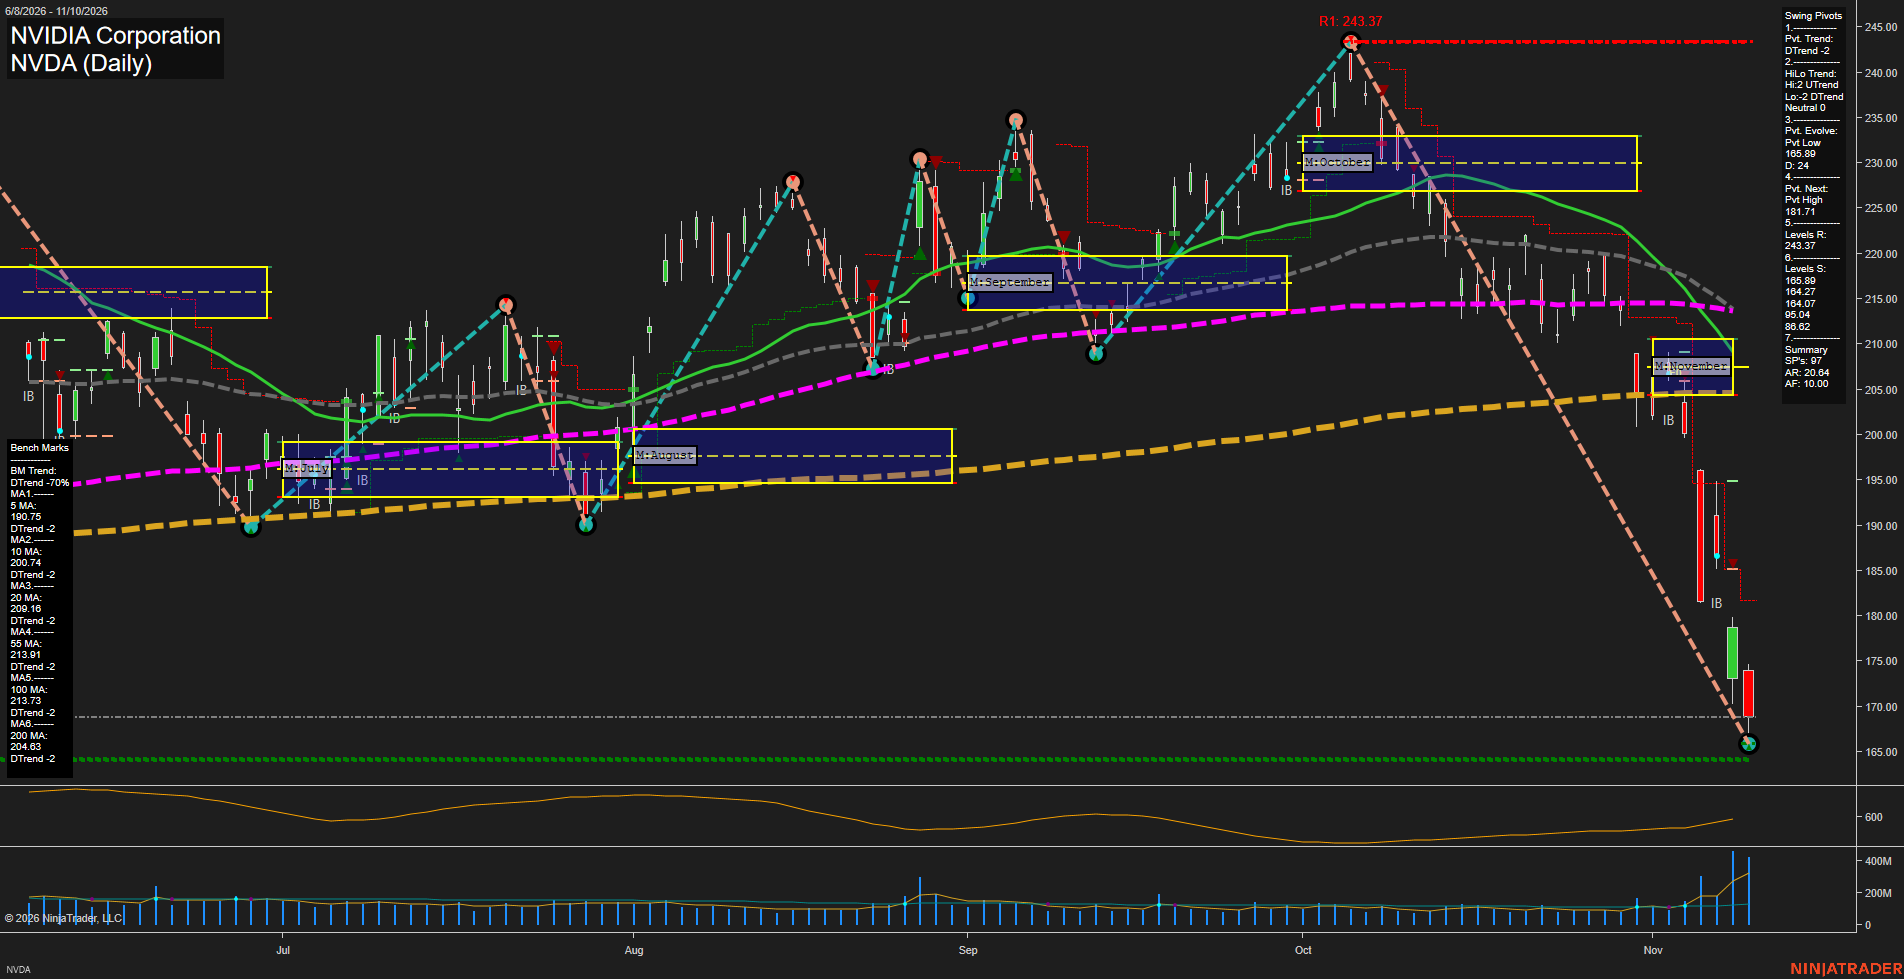
NVDA NVIDIA Corporation Daily Chart Analysis: 2026-Nov-11 07:11 CT
Price Action
- Last: 165.89,
- Bars: Large,
- Mom: fast.
WSFG Weekly
- Short-Term
- WSFG Current: NA%
- F0%/NTZ' Bias: Price Neutral,
- WSFG Trend: Neutral.
MSFG Month Nov
- Intermediate-Term
- MSFG Current: NA%
- F0%/NTZ' Bias: Price Below NTZ Lower,
- MSFG Trend: Bearish.
YSFG Year 2026
- Long-Term
- YSFG Current: NA%
- F0%/NTZ' Bias: Price Neutral,
- YSFG Trend: Neutral.
Swing Pivots
- (Short-Term) 1. Pvt. Trend: DTrend,
- (Intermediate-Term) 2. HiLo Trend: UTrend,
- 3. Pvt. Evolve: Pvt low 165.89,
- 4. Pvt. Next: Pvt high 181.71,
- 5. Levels R: 243.37,
- 6. Levels S: 165.89, 164.27, 164.07, 95.04, 86.62.
Daily Benchmarks
- (Short-Term) 5 Day: 190.75 Down Trend,
- (Short-Term) 10 Day: 200.74 Down Trend,
- (Intermediate-Term) 20 Day: 209.16 Down Trend,
- (Intermediate-Term) 55 Day: 213.91 Down Trend,
- (Long-Term) 100 Day: 213.73 Down Trend,
- (Long-Term) 200 Day: 204.03 Down Trend.
Additional Metrics
- ATR: 599,
- VOLMA: 346637249.
Overall Rating
- Short-Term: Bearish,
- Intermediate-Term: Bearish,
- Long-Term: Bearish.
Key Insights Summary
NVDA is in a sharp, high-volatility downside swing, with large-range bars and accelerated momentum following a breakdown through the November NTZ and every listed daily benchmark. The short-term pivot structure is a DTrend, although the intermediate HiLo structure remains UTrend until the larger support hierarchy fails. Price is testing the 165.89 pivot-low area, with 164.27 and 164.07 forming a tightly clustered support zone; the next pivot reversal reference is 181.71. The futures-style read is bearish and expansionary: elevated ATR, surging volume, lower highs from the 243.37 peak, and broad moving-average alignment point to an active liquidation phase rather than orderly consolidation.
Chart Analysis ATS AI Generated: 2026-11-11 07:11 for Informational use only, not trading advice. Terms and Risk Disclosure Copyright © 2026. Algo Trading Systems LLC.