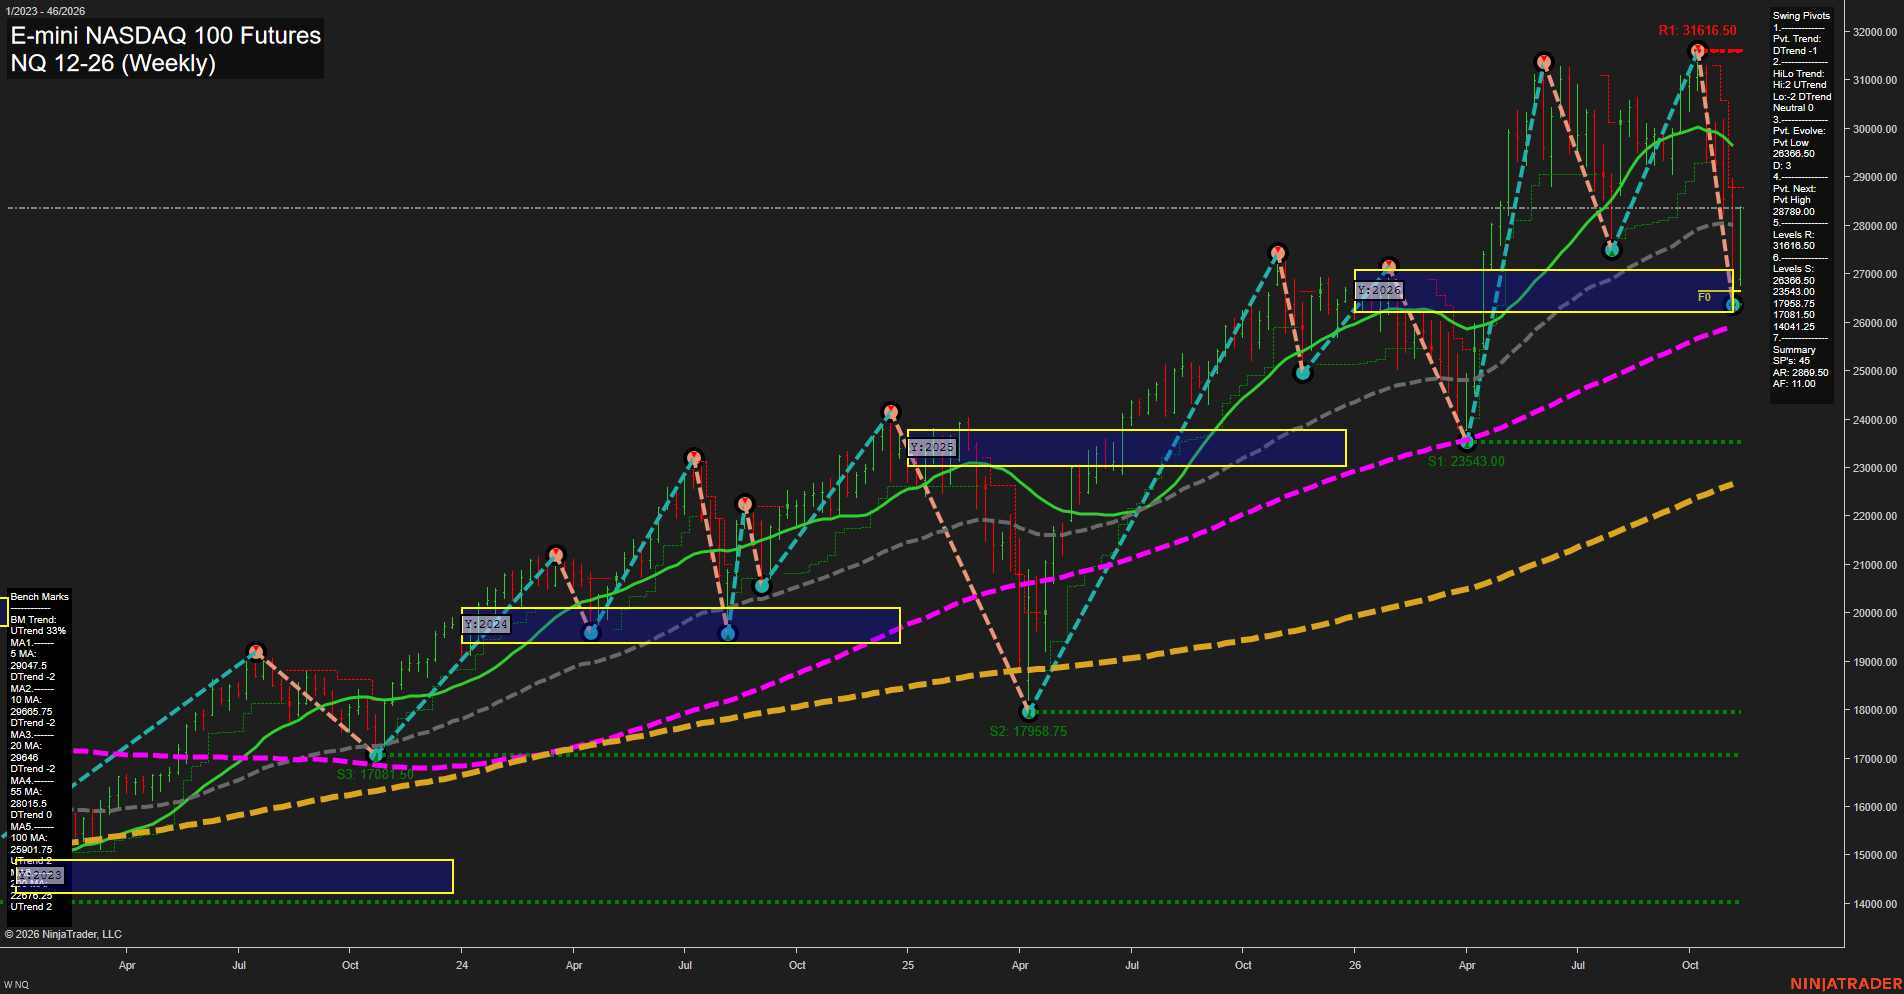
NQ E-mini NASDAQ 100 Futures Weekly Chart Analysis: 2026-Nov-11 07:10 CT
Price Action
- Last: 28389.00,
- Bars: Large,
- Mom: Fast.
WSFG Weekly
- Short-Term
- WSFG Current: 77%
- F0%/NTZ' Bias: Price Above,
- WSFG Trend: Up.
MSFG Month Nov
- Intermediate-Term
- MSFG Current: -9%
- F0%/NTZ' Bias: Price Below,
- MSFG Trend: Down.
YSFG Year 2026
- Long-Term
- YSFG Current: 39%
- F0%/NTZ' Bias: Price Above,
- YSFG Trend: Up.
Swing Pivots
- (Short-Term) 1. Pvt. Trend: DTrend,
- (Intermediate-Term) 2. HiLo Trend: UTrend,
- 3. Pvt. Evolve: Pvt low 26363.50,
- 4. Pvt. Next: Pvt high 28389.00,
- 5. Levels R: 31616.50,
- 6. Levels S: 26363.50, 23543.00, 17958.75, 17081.50, 14041.25.
Weekly Benchmarks
- (Short-Term) 5 Day: 29044.50 Down Trend,
- (Short-Term) 10 Day: 29865.75 Down Trend,
- (Intermediate-Term) 20 Day: 29640.00 Down Trend,
- (Intermediate-Term) 55 Day: 28015.50 Up Trend,
- (Long-Term) 100 Day: 25901.75 Up Trend,
- (Long-Term) 200 Day: 22070.25 Up Trend.
Recent Trade Signals
- 09 Nov 2026: Long NQ 12-26 @ 27927 Signals.USAR.TR120
- 09 Nov 2026: Long NQ 12-26 @ 27076 Signals.USAR-WSFG
- 03 Nov 2026: Short NQ 12-26 @ 28103.25 Signals.USAR-MSFG
Overall Rating
- Short-Term: Neutral,
- Intermediate-Term: Neutral,
- Long-Term: Bullish.
Key Insights Summary
The weekly structure reflects a sharp, high-volatility retracement from the 31616.50 pivot high into the 26363.50 pivot low, followed by a rebound toward 28389.00. Short-term conditions are mixed: the weekly grid and recent short-term signals remain positive, while the active pivot trend and 5-, 10-, and 20-period benchmarks remain down. Intermediate structure is consolidative, with the monthly grid below its F0% level but the higher-low pivot structure and rising 55-period benchmark still intact. The long-term trend remains constructive as price holds above the rising 100- and 200-period benchmarks and the yearly grid remains positive. The 26363.50 swing low is the principal nearby structural support, while 31616.50 defines the major overhead pivot resistance.
Chart Analysis ATS AI Generated: 2026-11-11 07:11 for Informational use only, not trading advice. Terms and Risk Disclosure Copyright © 2026. Algo Trading Systems LLC.