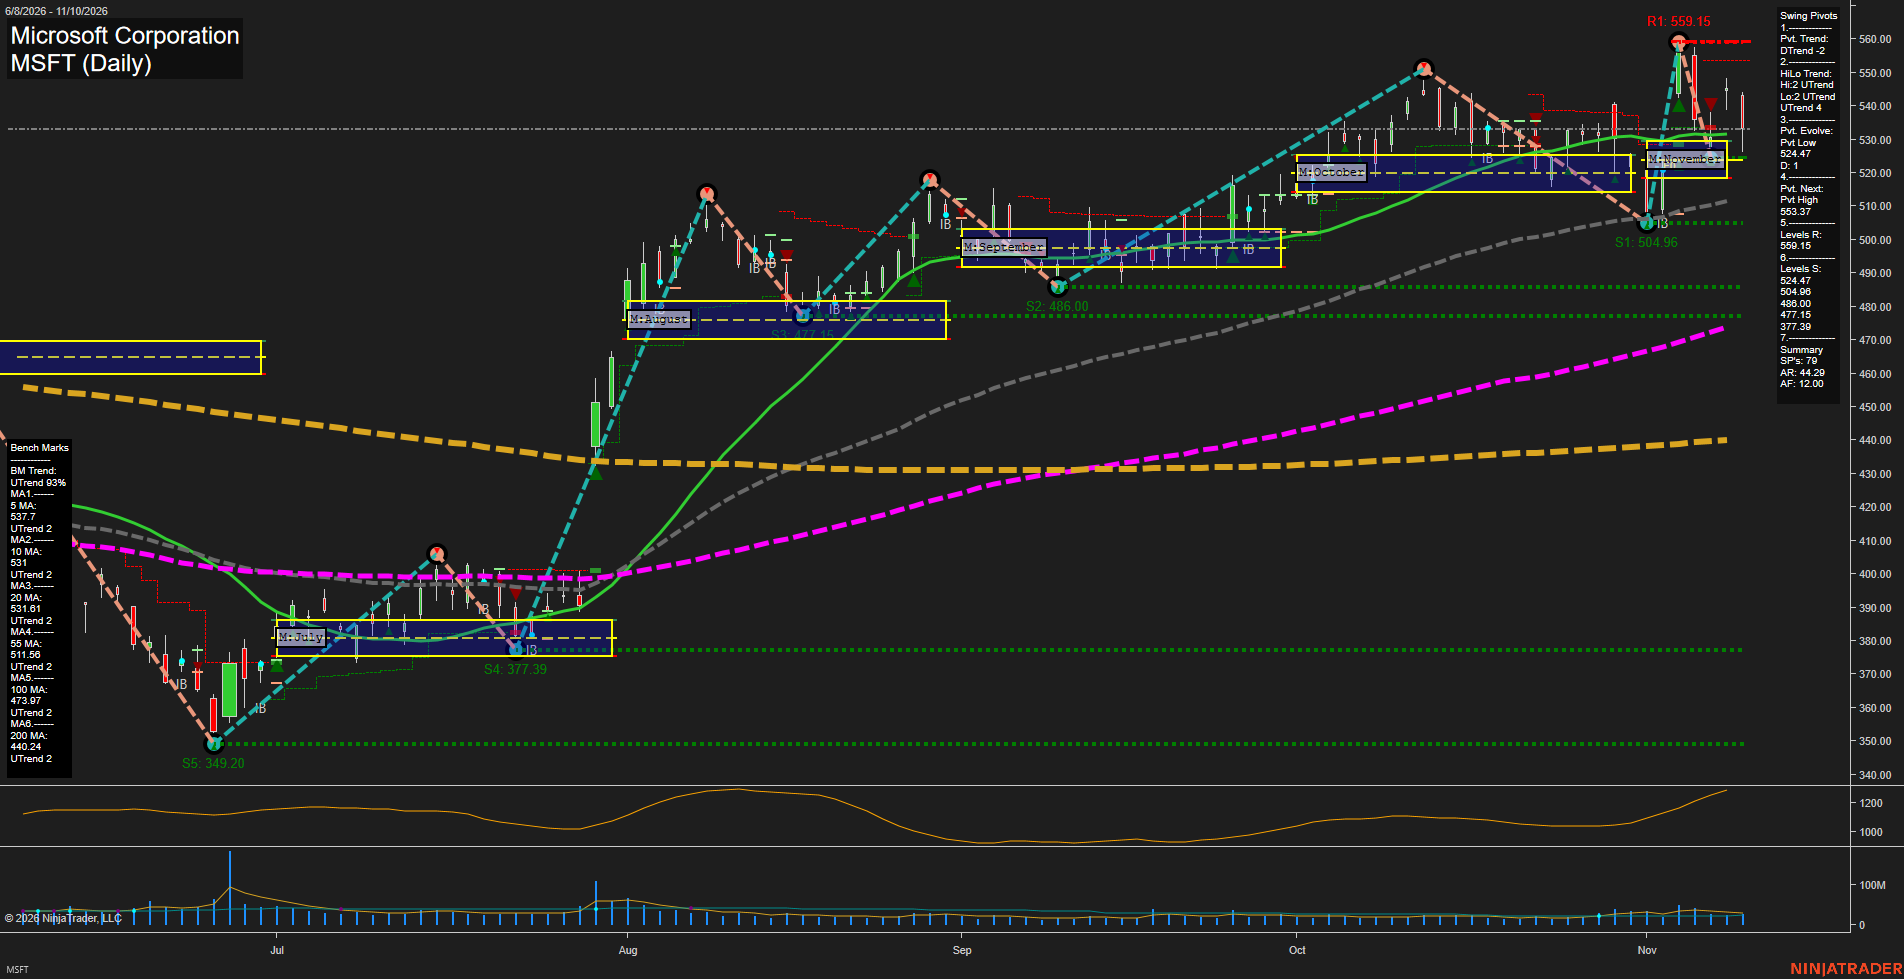
MSFT Microsoft Corporation Daily Chart Analysis: 2026-Nov-11 07:09 CT
Price Action
- Last: 532.00,
- Bars: Large,
- Mom: fast.
WSFG Weekly
- Short-Term
- WSFG Current: NA%
- F0%/NTZ' Bias: Price Neutral,
- WSFG Trend: Neutral.
MSFG Month Nov
- Intermediate-Term
- MSFG Current: NA%
- F0%/NTZ' Bias: Price Above NTZ,
- MSFG Trend: Bullish.
YSFG Year 2026
- Long-Term
- YSFG Current: NA%
- F0%/NTZ' Bias: Price Neutral,
- YSFG Trend: Neutral.
Swing Pivots
- (Short-Term) 1. Pvt. Trend: DTrend,
- (Intermediate-Term) 2. HiLo Trend: UTrend,
- 3. Pvt. Evolve: Pvt low 524.47,
- 4. Pvt. Next: Pvt high 553.37,
- 5. Levels R: 559.15,
- 6. Levels S: 524.06, 504.96, 486.00, 477.15, 377.39, 349.20.
Daily Benchmarks
- (Short-Term) 5 Day: 537.70 Up Trend,
- (Short-Term) 10 Day: 531.00 Up Trend,
- (Intermediate-Term) 20 Day: 531.61 Up Trend,
- (Intermediate-Term) 55 Day: 511.56 Up Trend,
- (Long-Term) 100 Day: 473.92 Up Trend,
- (Long-Term) 200 Day: 440.24 Up Trend.
Additional Metrics
- ATR: 12.00,
- VOLMA: 44290000.
Overall Rating
- Short-Term: Neutral,
- Intermediate-Term: Bullish,
- Long-Term: Bullish.
Key Insights Summary
MSFT futures-equivalent price action shows a high-volatility rebound from the 504.96 support area, followed by a pullback beneath the rising 5-day average near 537.70. The short-term pivot structure remains in DTrend while price holds near the 10-day and 20-day benchmark cluster around 531, creating a near-term consolidation and reversal zone. The intermediate pivot structure remains UTrend, supported by higher swing lows and price holding materially above the rising 55-day, 100-day, and 200-day averages. The 524.06 pivot-support area is the principal short-term structural reference, while 553.37 to 559.15 defines the overhead swing-high resistance region. Rising ATR reflects expanded daily range conditions and a more active futures-style swing environment.
Chart Analysis ATS AI Generated: 2026-11-11 07:09 for Informational use only, not trading advice. Terms and Risk Disclosure Copyright © 2026. Algo Trading Systems LLC.