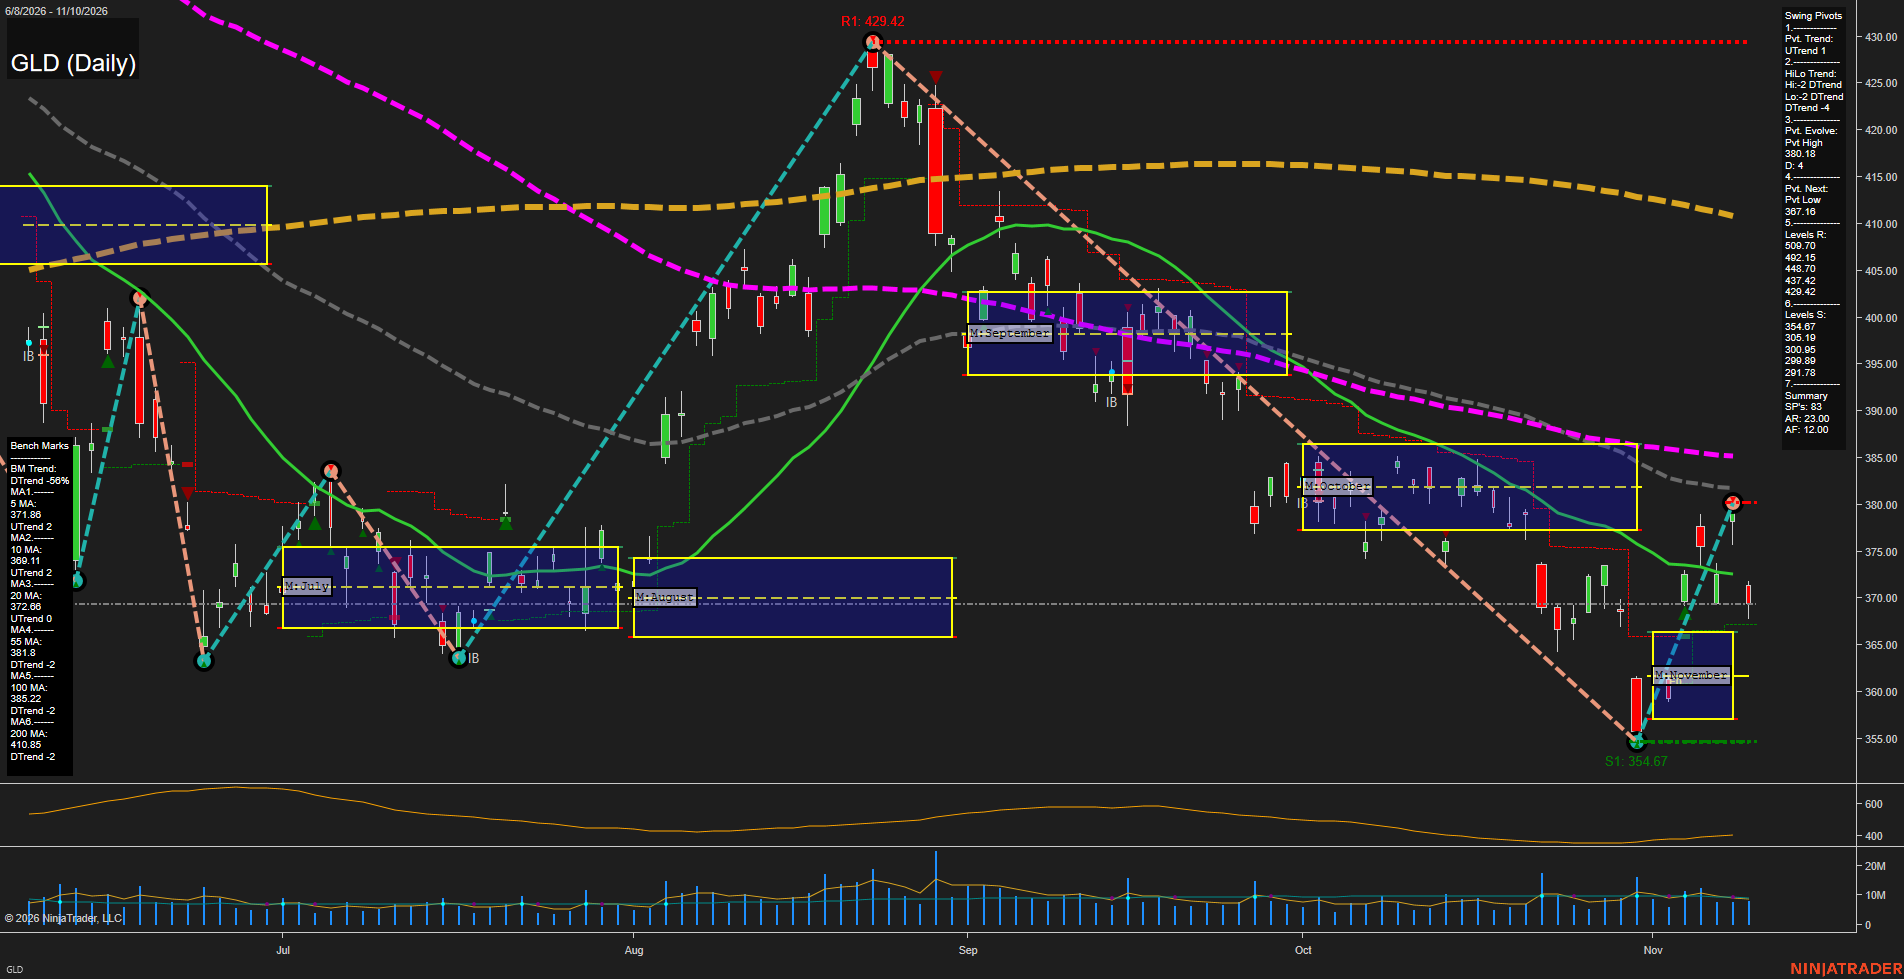
GLD SPDR Gold Shares Daily Chart Analysis: 2026-Nov-11 07:07 CT
Price Action
- Last: 370.00,
- Bars: Small,
- Mom: Average.
WSFG Weekly
- Short-Term
- WSFG Current: NA%
- F0%/NTZ' Bias: Price Neutral,
- WSFG Trend: Neutral.
MSFG Month Nov
- Intermediate-Term
- MSFG Current: NA%
- F0%/NTZ' Bias: Price Bullish,
- MSFG Trend: UTrend.
YSFG Year 2026
- Long-Term
- YSFG Current: NA%
- F0%/NTZ' Bias: Price Neutral,
- YSFG Trend: Neutral.
Swing Pivots
- (Short-Term) 1. Pvt. Trend: UTrend,
- (Intermediate-Term) 2. HiLo Trend: DTrend,
- 3. Pvt. Evolve: Pvt High 380.18,
- 4. Pvt. Next: Pvt Low 367.16,
- 5. Levels R: 509.70, 492.15, 438.70, 437.42, 429.42,
- 6. Levels S: 364.67, 305.19, 300.85, 299.89, 291.78.
Daily Benchmarks
- (Short-Term) 5 Day: 371.88 Up Trend,
- (Short-Term) 10 Day: 369.11 Up Trend,
- (Intermediate-Term) 20 Day: 372.68 Up Trend,
- (Intermediate-Term) 55 Day: 381.30 Down Trend,
- (Long-Term) 100 Day: 389.37 Down Trend,
- (Long-Term) 200 Day: 410.85 Down Trend.
Additional Metrics
- ATR: 23.00,
- VOLMA: 7207880.
Overall Rating
- Short-Term: Neutral,
- Intermediate-Term: Bearish,
- Long-Term: Bearish.
Key Insights Summary
GLD, as a liquid proxy for gold futures swing conditions, is holding a short-term pivot uptrend after the 354.67 low and rebound toward 380.18. The latest small red bar reflects a pullback from that rebound, with 367.16 defining the nearby pivot-reversal reference. Price remains above the November monthly NTZ, but is below the 5-day and 20-day benchmark area near 371.88-372.68 and well beneath declining 55-, 100-, and 200-day averages. The broader structure remains a countertrend recovery within an intermediate and long-term downtrend, characterized by lower highs from the August peak and overhead resistance near 380.18, 381.30, and 389.37. Volatility remains elevated, consistent with wide gold-futures style daily rotations and choppy retracement conditions.
Chart Analysis ATS AI Generated: 2026-11-11 07:07 for Informational use only, not trading advice. Terms and Risk Disclosure Copyright © 2026. Algo Trading Systems LLC.