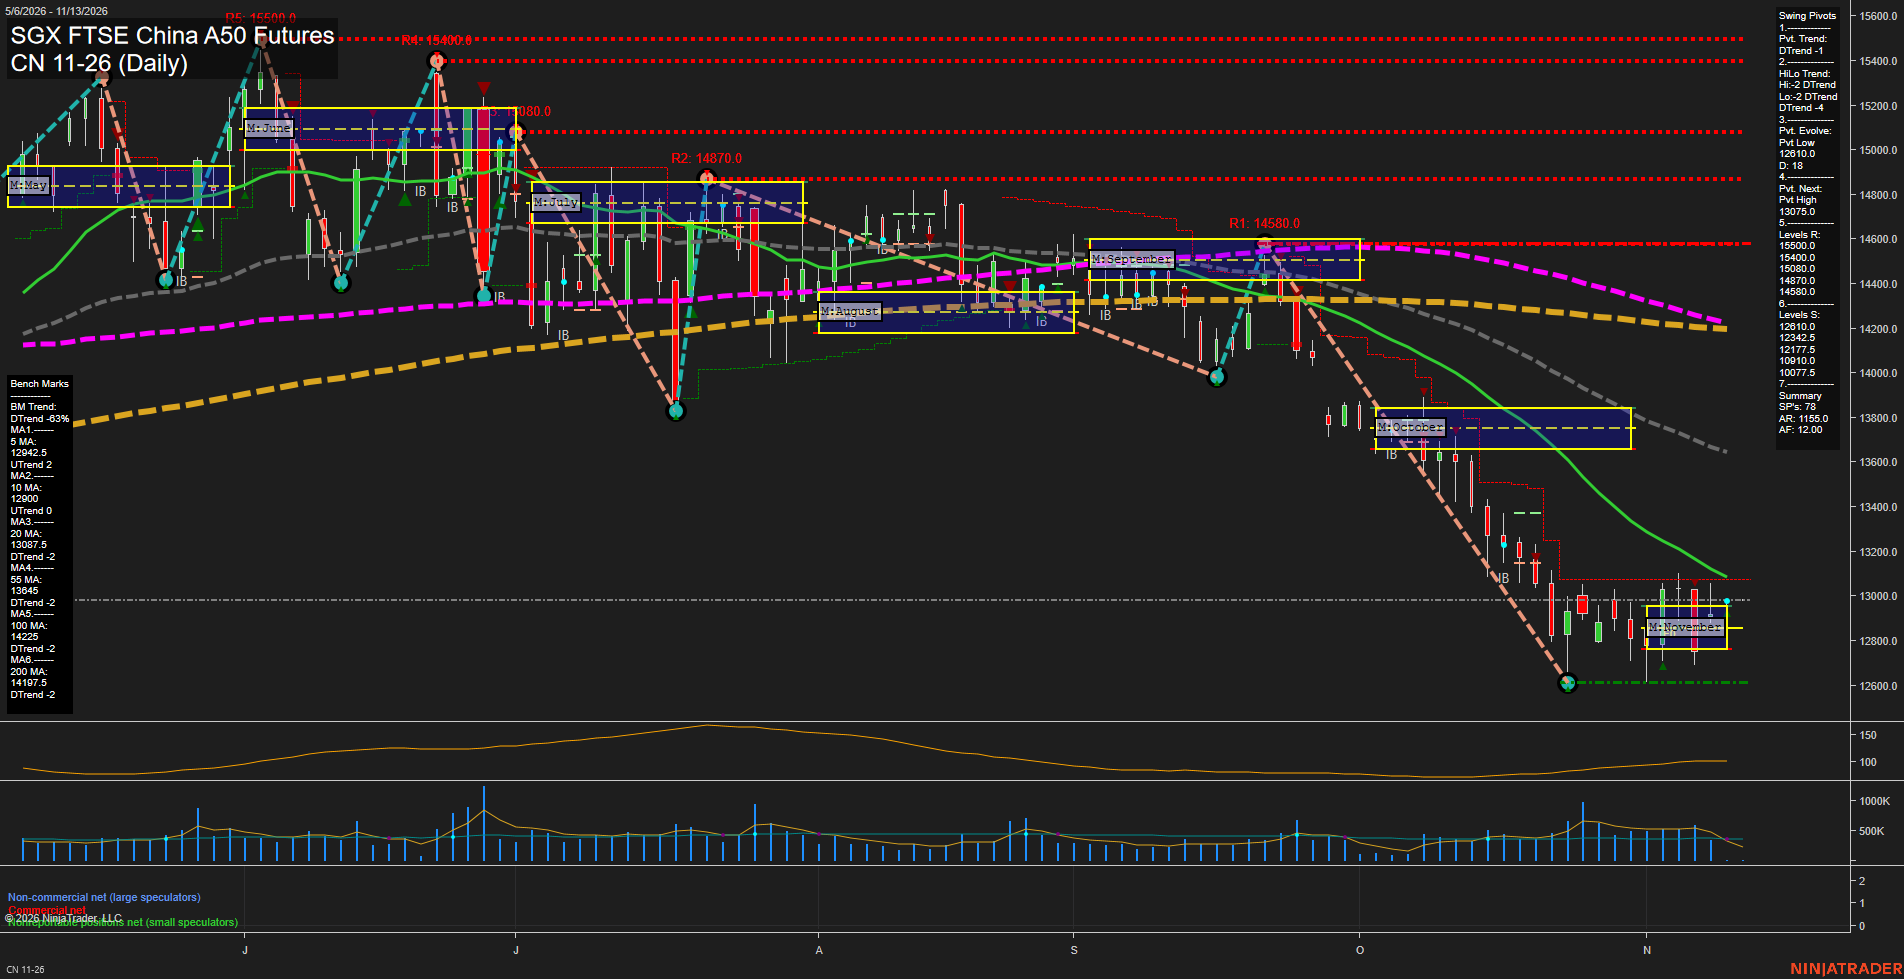
CN SGX FTSE China A50 Futures Daily Chart Analysis: 2026-Nov-11 07:03 CT
Price Action
- Last: 12977.5,
- Bars: Small,
- Mom: Slow.
WSFG Weekly
- Short-Term
- WSFG Current: NA%
- F0%/NTZ' Bias: Price Neutral,
- WSFG Trend: Neutral.
MSFG Month Nov
- Intermediate-Term
- MSFG Current: 85%
- F0%/NTZ' Bias: Price Above,
- MSFG Trend: Neutral.
YSFG Year 2026
- Long-Term
- YSFG Current: NA%
- F0%/NTZ' Bias: Price Neutral,
- YSFG Trend: Neutral.
Swing Pivots
- (Short-Term) 1. Pvt. Trend: DTrend,
- (Intermediate-Term) 2. HiLo Trend: DTrend,
- 3. Pvt. Evolve: Pvt low 12610.0,
- 4. Pvt. Next: Pvt high 13075.0,
- 5. Levels R: 15500.0, 15400.0, 15080.0, 14870.0, 14580.0,
- 6. Levels S: 12610.0, 12342.5, 12177.5, 10910.0, 10077.5.
Daily Benchmarks
- (Short-Term) 5 Day: 12942.5 Up Trend,
- (Short-Term) 10 Day: 12900.0 Up Trend,
- (Intermediate-Term) 20 Day: 13087.5 Down Trend,
- (Intermediate-Term) 55 Day: 13645.0 Down Trend,
- (Long-Term) 100 Day: 14225.0 Down Trend,
- (Long-Term) 200 Day: 14197.5 Down Trend.
Additional Metrics
- ATR: 115.0,
- VOLMA: 12.00.
Overall Rating
- Short-Term: Bearish,
- Intermediate-Term: Bearish,
- Long-Term: Bearish.
Key Insights Summary
Price is consolidating in a narrow November NTZ after an extended October-November liquidation leg that established a 12610.0 pivot low. Small daily bars and slow momentum reflect compression and a short-term stabilization phase, while the 5- and 10-day averages have turned upward beneath price. The broader swing structure remains bearish: both pivot trend measures are in DTrend, price remains below the declining 20-, 55-, 100-, and 200-day benchmarks, and 13075.0 is the active opposing pivot threshold. The market is forming a base-like range above 12610.0, but the larger pattern continues to show lower highs and lower lows following the rejection from the September-October range near 14580.0.
Chart Analysis ATS AI Generated: 2026-11-11 07:04 for Informational use only, not trading advice. Terms and Risk Disclosure Copyright © 2026. Algo Trading Systems LLC.