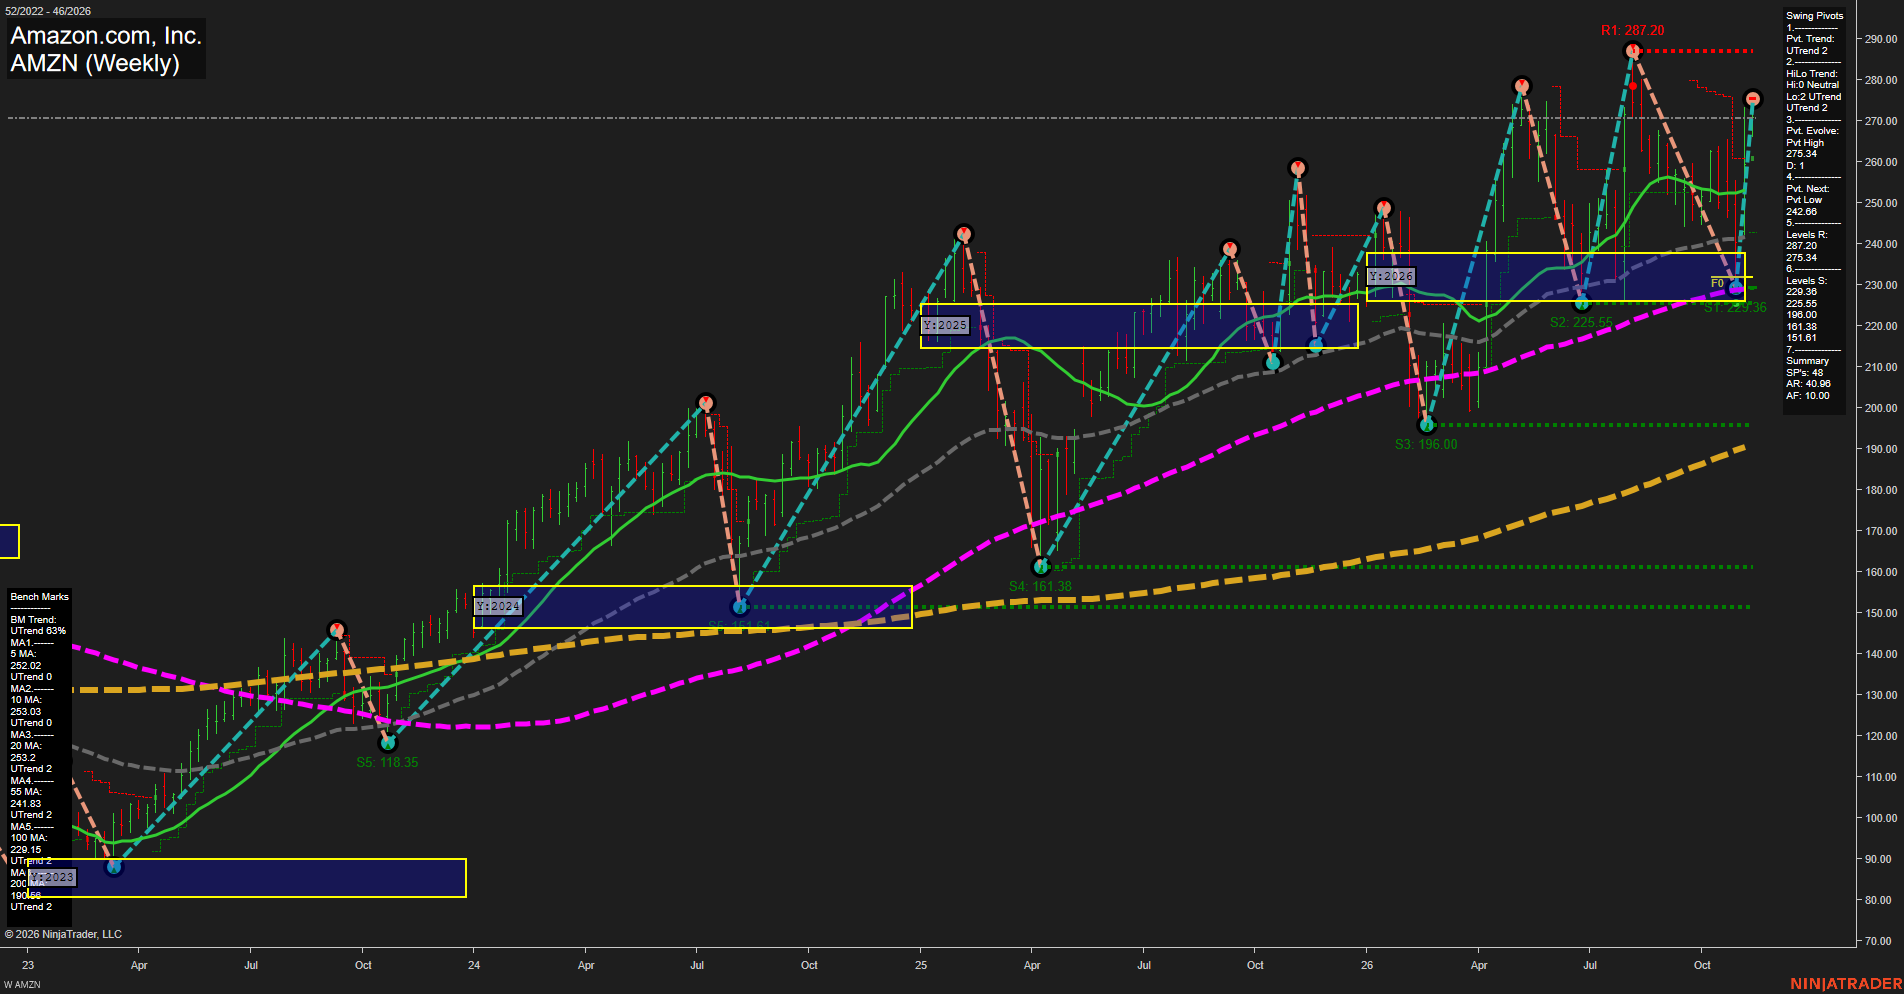
AMZN Amazon.com; Inc. Weekly Chart Analysis: 2026-Nov-11 07:02 CT
Price Action
- Last: 275.34,
- Bars: Large,
- Mom: fast.
WSFG Weekly
- Short-Term
- WSFG Current: NA%
- F0%/NTZ' Bias: Price Bullish,
- WSFG Trend: Bullish.
MSFG Month Nov
- Intermediate-Term
- MSFG Current: NA%
- F0%/NTZ' Bias: Price Bullish,
- MSFG Trend: Bullish.
YSFG Year 2026
- Long-Term
- YSFG Current: NA%
- F0%/NTZ' Bias: Price Bullish,
- YSFG Trend: Bullish.
Swing Pivots
- (Short-Term) 1. Pvt. Trend: DTrend,
- (Intermediate-Term) 2. HiLo Trend: UTrend,
- 3. Pvt. Evolve: Pvt high 275.34,
- 4. Pvt. Next: Pvt low 242.68,
- 5. Levels R: 287.20, 275.34,
- 6. Levels S: 229.36, 225.55, 196.00, 161.38, 151.61.
Weekly Benchmarks
- (Short-Term) 5 Day: 252.00 Up Trend,
- (Short-Term) 10 Day: 253.03 Up Trend,
- (Intermediate-Term) 20 Day: 253.72 Up Trend,
- (Intermediate-Term) 55 Day: 241.83 Up Trend,
- (Long-Term) 100 Day: 229.15 Up Trend,
- (Long-Term) 200 Day: 180.68 Up Trend.
Overall Rating
- Short-Term: Neutral,
- Intermediate-Term: Bullish,
- Long-Term: Bullish.
Key Insights Summary
AMZN’s weekly structure remains broadly bullish from a futures swing-trading perspective: price is materially above all rising benchmark averages, above the yearly F0%/NTZ area, and the intermediate pivot sequence remains in an uptrend. The latest large upside weekly bar has driven price into the 275.34 pivot-high area, with 287.20 representing the next visible overhead resistance. Short-term pivot status remains DTrend because the current swing is classified as a pivot high and requires a reversal toward 242.68 to establish the next pivot low. The 252-254 benchmark cluster and the 241.83 55-period average define the nearest rising trend structure, while 229.36-225.55 is the major weekly support zone. The current pattern reflects strong upside momentum and a retest of prior highs within a broader higher-high, higher-low cycle.
Chart Analysis ATS AI Generated: 2026-11-11 07:03 for Informational use only, not trading advice. Terms and Risk Disclosure Copyright © 2026. Algo Trading Systems LLC.