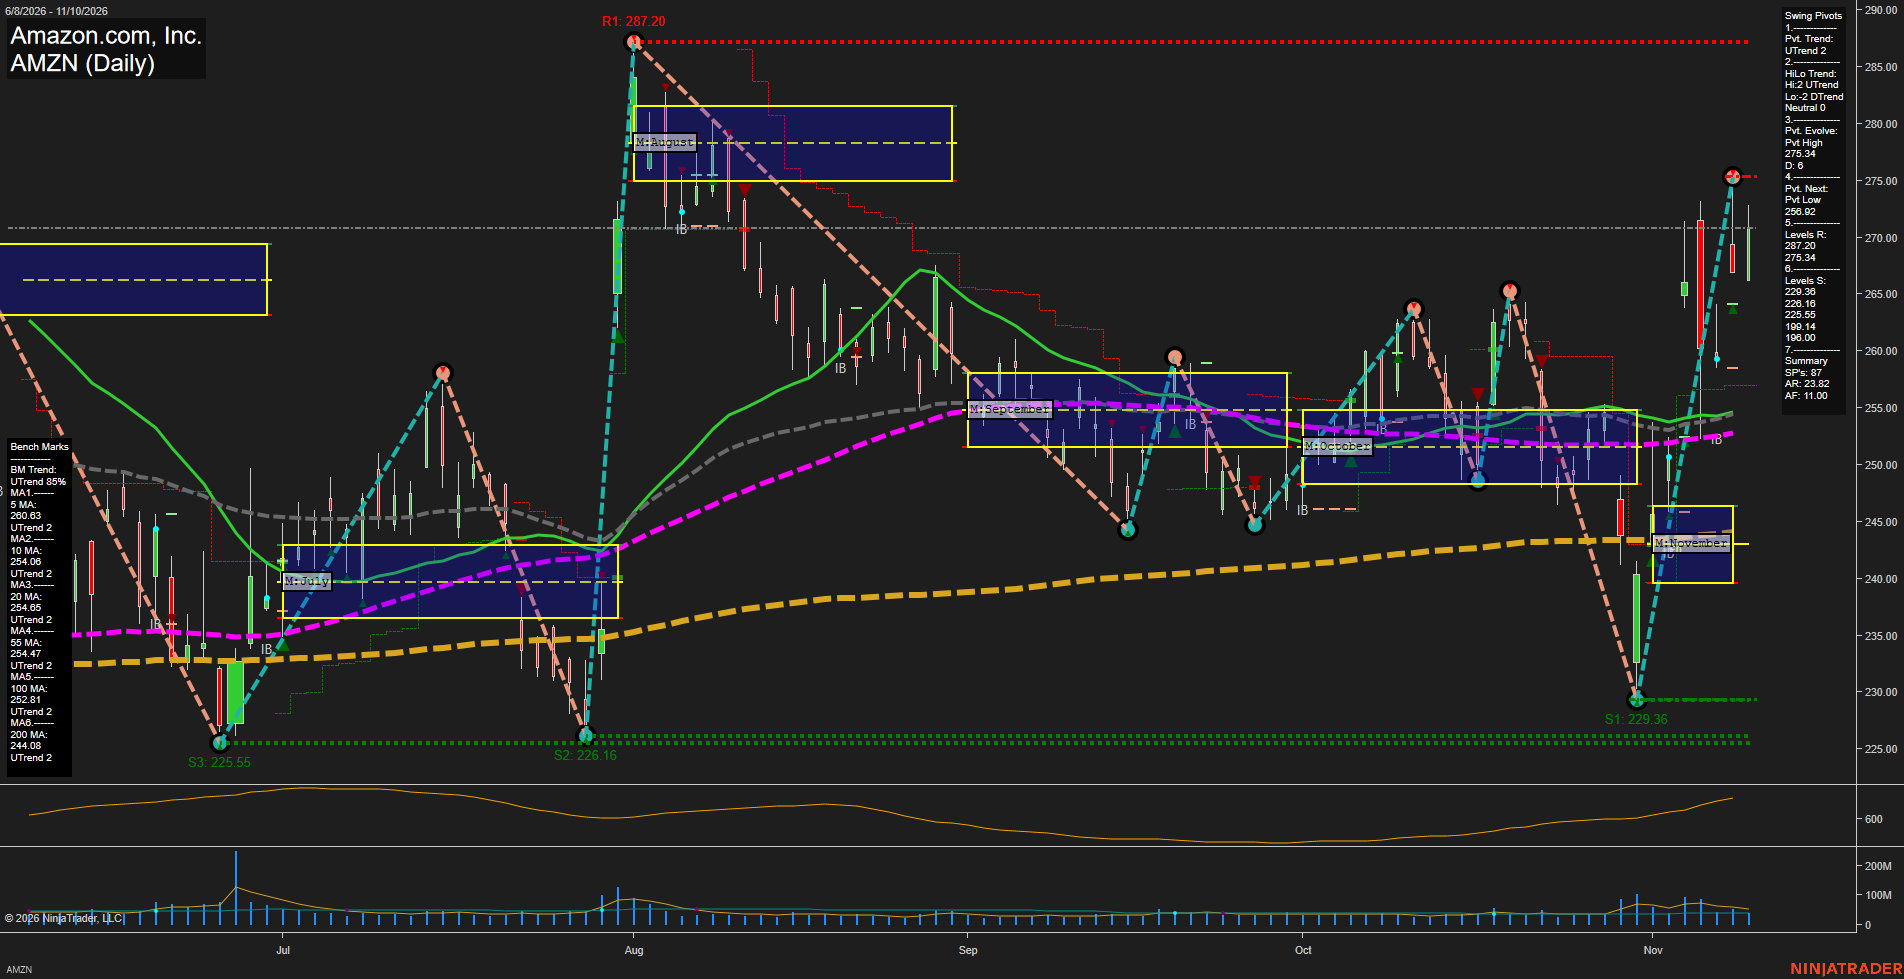
AMZN Amazon.com; Inc. Daily Chart Analysis: 2026-Nov-11 07:02 CT
Price Action
- Last: 275.34,
- Bars: Large,
- Mom: fast.
WSFG Weekly
- Short-Term
- WSFG Current: NA%
- F0%/NTZ' Bias: Price Bullish,
- WSFG Trend: Bullish.
MSFG Month Nov
- Intermediate-Term
- MSFG Current: NA%
- F0%/NTZ' Bias: Price Bullish,
- MSFG Trend: Bullish.
YSFG Year 2026
- Long-Term
- YSFG Current: NA%
- F0%/NTZ' Bias: Price Bullish,
- YSFG Trend: Bullish.
Swing Pivots
- (Short-Term) 1. Pvt. Trend: UTrend,
- (Intermediate-Term) 2. HiLo Trend: UTrend,
- 3. Pvt. Evolve: Pvt high 275.34,
- 4. Pvt. Next: Pvt low 256.92,
- 5. Levels R: 287.20, 275.34,
- 6. Levels S: 229.36, 226.16, 225.55, 199.14, 198.00.
Daily Benchmarks
- (Short-Term) 5 Day: 260.63 Up Trend,
- (Short-Term) 10 Day: 254.06 Up Trend,
- (Intermediate-Term) 20 Day: 254.65 Up Trend,
- (Intermediate-Term) 55 Day: 254.47 Up Trend,
- (Long-Term) 100 Day: 252.81 Up Trend,
- (Long-Term) 200 Day: 244.08 Up Trend.
Additional Metrics
- ATR: 23.82,
- VOLMA: 33608198.
Overall Rating
- Short-Term: Bullish,
- Intermediate-Term: Bullish,
- Long-Term: Bullish.
Key Insights Summary
AMZN has produced a fast, high-range upside repricing from the November low area near 229.36 into a new short-term pivot high at 275.34. From a futures swing-trader perspective, the structure is decisively trend-positive: price is above every benchmark average, all six averages are rising, and both the short-term pivot trend and intermediate HiLo trend remain UTrend. The advance has cleared the November NTZ and is extended above the monthly grid, reflecting strong directional momentum rather than balanced consolidation. The principal upside structural reference is 287.20, while 275.34 is the immediate pivot-high reference. The 256.92 pivot-next level and the clustered 254.06-254.65 benchmark area define the nearest deeper mean-reversion zone within the broader bullish structure. Elevated ATR and expanding recent volume indicate a more volatile, momentum-driven phase following the sharp V-style recovery from the late-October/early-November selloff.
Chart Analysis ATS AI Generated: 2026-11-11 07:02 for Informational use only, not trading advice. Terms and Risk Disclosure Copyright © 2026. Algo Trading Systems LLC.