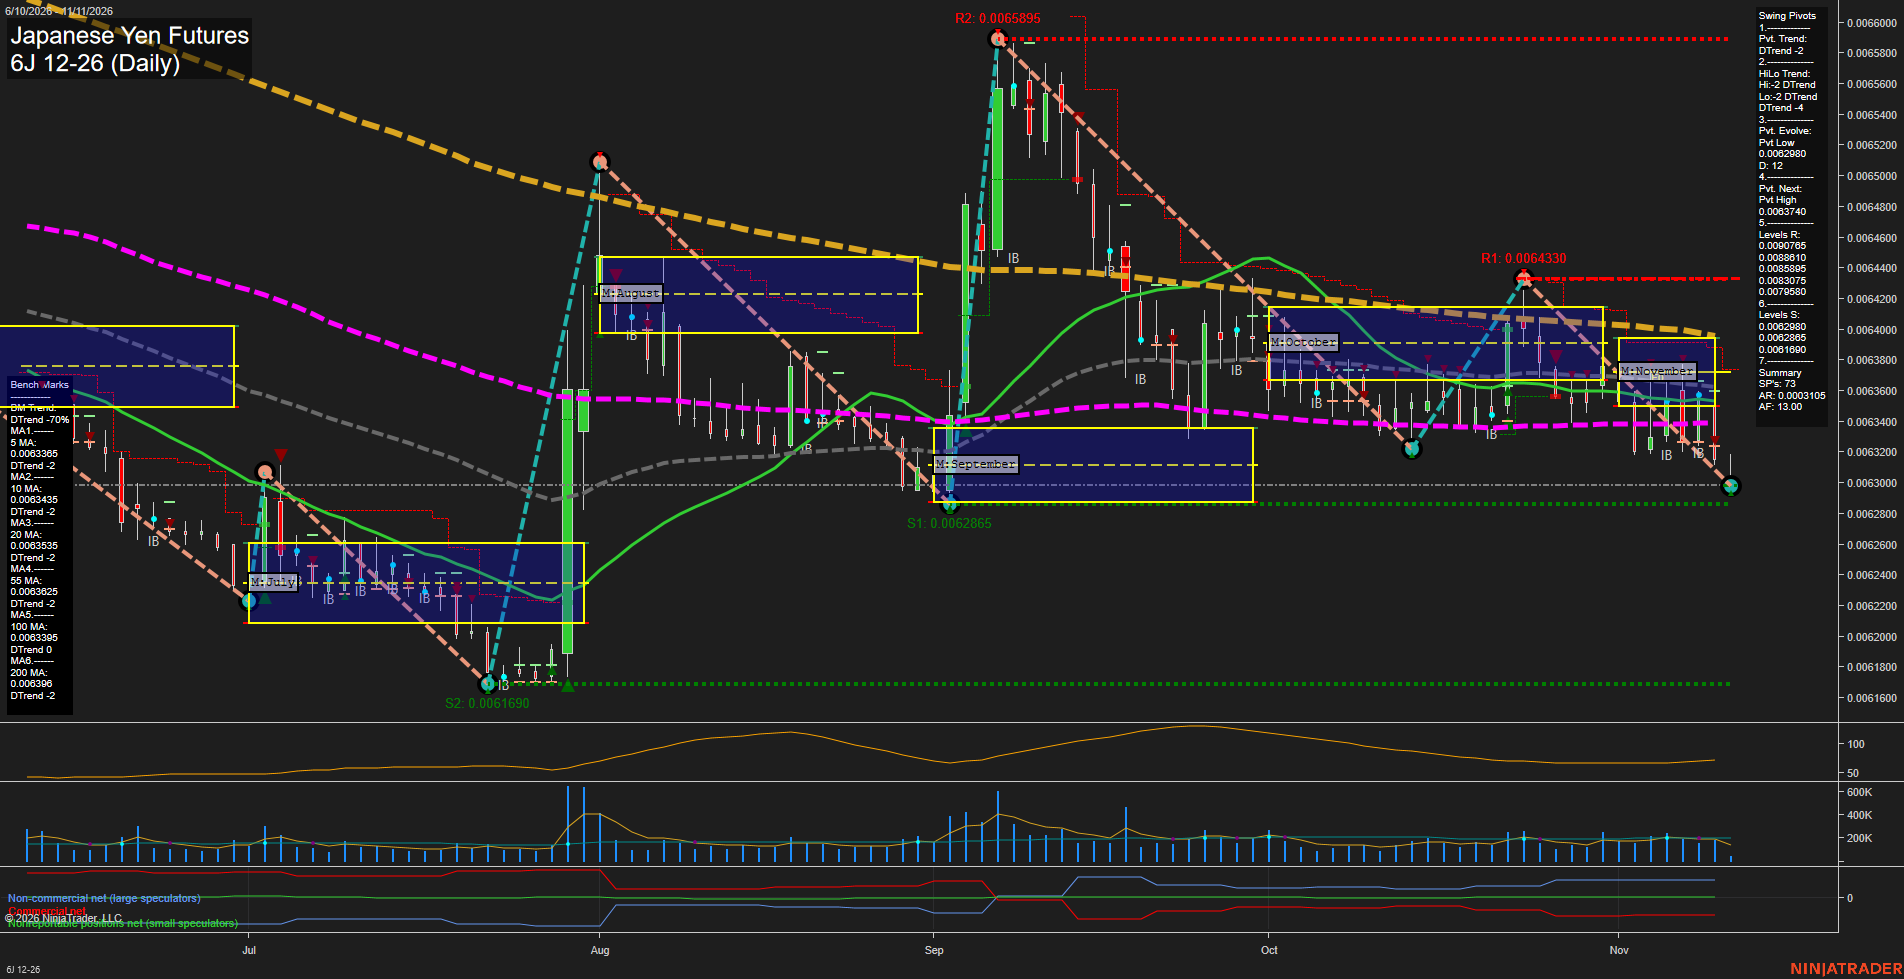
6J Japanese Yen Futures Daily Chart Analysis: 2026-Nov-11 07:01 CT
Price Action
- Last: 0.0062960,
- Bars: Small,
- Mom: slow.
WSFG Weekly
- Short-Term
- WSFG Current: -43%
- F0%/NTZ' Bias: Price Below,
- WSFG Trend: Down.
MSFG Month Nov
- Intermediate-Term
- MSFG Current: -34%
- F0%/NTZ' Bias: Price Below,
- MSFG Trend: Down.
YSFG Year 2026
- Long-Term
- YSFG Current: -24%
- F0%/NTZ' Bias: Price Below,
- YSFG Trend: Down.
Swing Pivots
- (Short-Term) 1. Pvt. Trend: DTrend,
- (Intermediate-Term) 2. HiLo Trend: DTrend,
- 3. Pvt. Evolve: Pvt low 0.0062980,
- 4. Pvt. Next: Pvt high 0.0063740,
- 5. Levels R: 0.0065785, 0.0064330, 0.0063740,
- 6. Levels S: 0.0062980, 0.0062865, 0.0061690.
Daily Benchmarks
- (Short-Term) 5 Day: 0.0063365 Down Trend,
- (Short-Term) 10 Day: 0.0063435 Down Trend,
- (Intermediate-Term) 20 Day: 0.0063535 Down Trend,
- (Intermediate-Term) 55 Day: 0.0063825 Down Trend,
- (Long-Term) 100 Day: 0.0063309 Down Trend,
- (Long-Term) 200 Day: 0.0063396 Down Trend.
Additional Metrics
Recent Trade Signals
- 10 Nov 2026: Short 6J 12-26 @ 0.0063185 Signals.USAR.TR120
- 10 Nov 2026: Short 6J 12-26 @ 0.0063185 Signals.USAR-WSFG
Overall Rating
- Short-Term: Bearish,
- Intermediate-Term: Bearish,
- Long-Term: Bearish.
Key Insights Summary
Price is pressing the developing 0.0062980 pivot-low area after a sequence of lower highs from the September peak and a failed October rebound. The weekly, monthly, and yearly fib-grid readings are below their respective F0% areas, while price remains below every daily benchmark. The compressed small-range decline reflects slow downside momentum rather than a high-volatility liquidation phase. The 0.0062980 to 0.0062865 support zone defines the immediate swing structure, with 0.0063740 the nearest pivot-based recovery threshold and 0.0064330 the larger overhead resistance area.
Chart Analysis ATS AI Generated: 2026-11-11 07:01 for Informational use only, not trading advice. Terms and Risk Disclosure Copyright © 2026. Algo Trading Systems LLC.