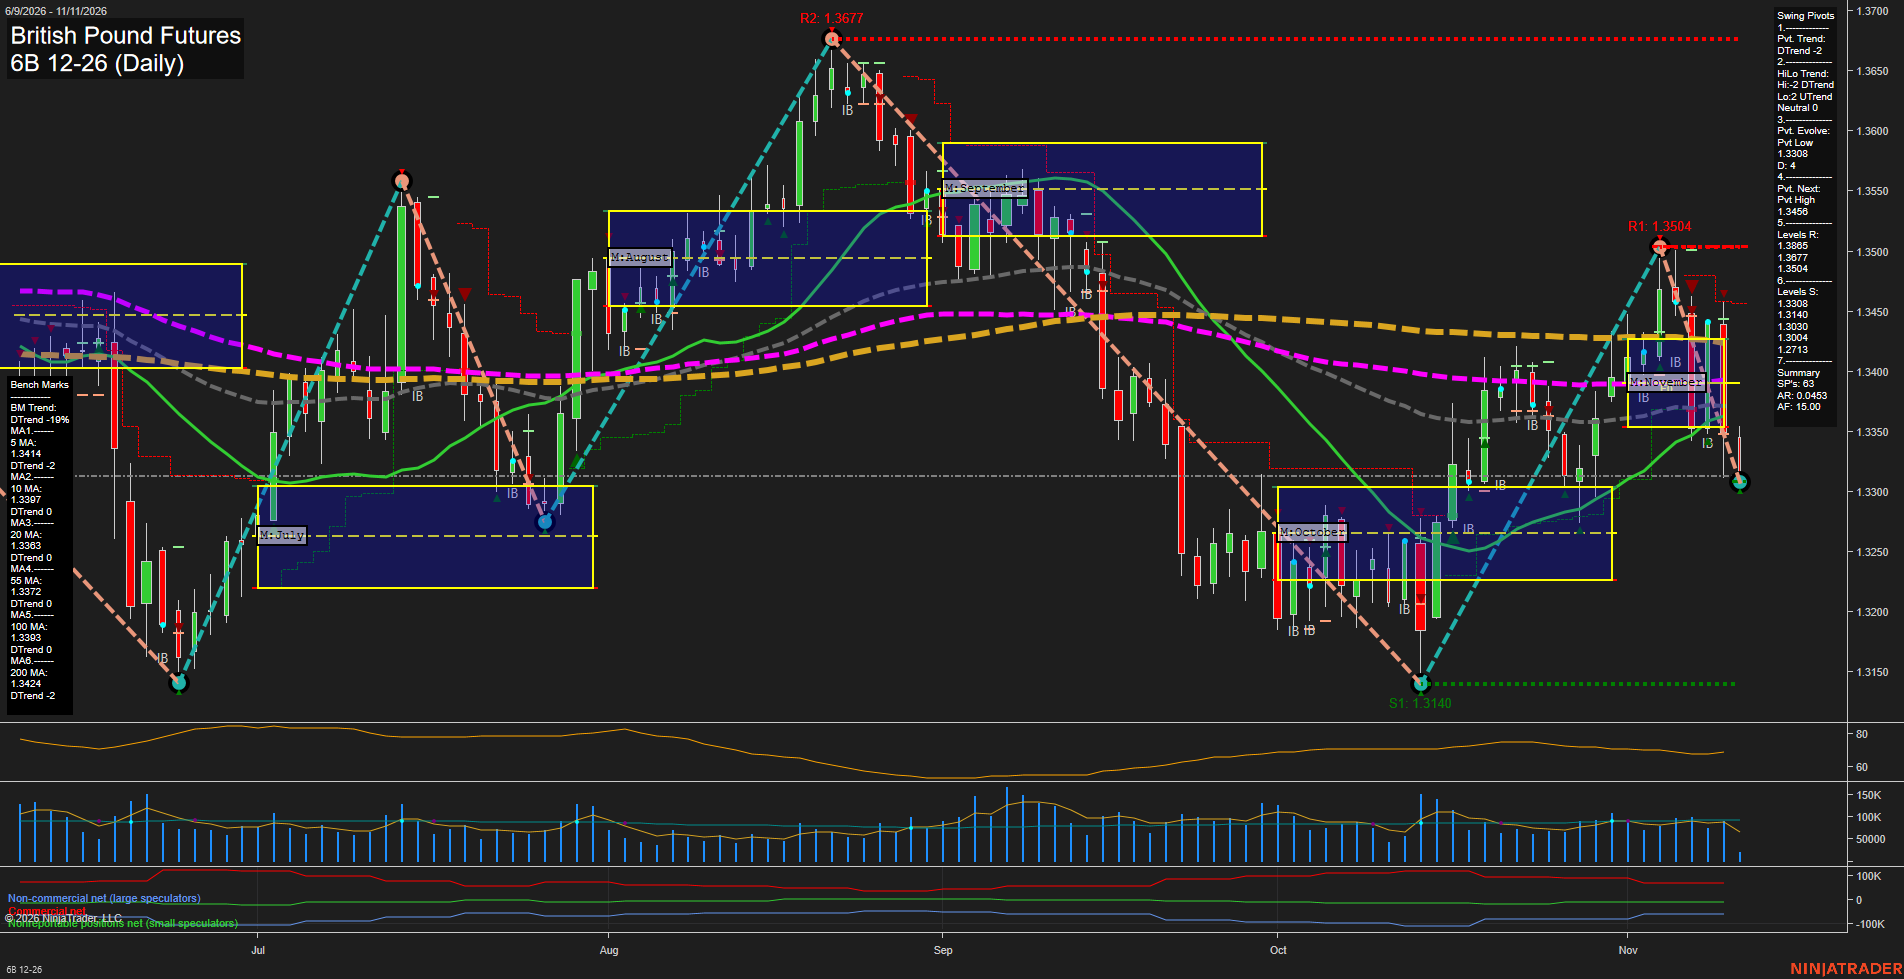
6B British Pound Futures Daily Chart Analysis: 2026-Nov-11 07:00 CT
Price Action
- Last: 1.3308,
- Bars: Large,
- Mom: fast.
WSFG Weekly
- Short-Term
- WSFG Current: -23%
- F0%/NTZ' Bias: Price Below,
- WSFG Trend: Down.
MSFG Month Nov
- Intermediate-Term
- MSFG Current: -26%
- F0%/NTZ' Bias: Price Below,
- MSFG Trend: Down.
YSFG Year 2026
- Long-Term
- YSFG Current: -11%
- F0%/NTZ' Bias: Price Below,
- YSFG Trend: Down.
Swing Pivots
- (Short-Term) 1. Pvt. Trend: DTrend,
- (Intermediate-Term) 2. HiLo Trend: DTrend,
- 3. Pvt. Evolve: Pvt low 1.3308,
- 4. Pvt. Next: Pvt high 1.3458,
- 5. Levels R: 1.3677, 1.3565, 1.3504,
- 6. Levels S: 1.3308, 1.3140, 1.3030, 1.3004, 1.2713.
Daily Benchmarks
- (Short-Term) 5 Day: 1.3414 Down Trend,
- (Short-Term) 10 Day: 1.3397 Down Trend,
- (Intermediate-Term) 20 Day: 1.3363 Down Trend,
- (Intermediate-Term) 55 Day: 1.3372 Down Trend,
- (Long-Term) 100 Day: 1.3393 Down Trend,
- (Long-Term) 200 Day: 1.3424 Down Trend.
Additional Metrics
Recent Trade Signals
- 11 Nov 2026: Short 6B 12-26 @ 1.3331 Signals.USAR-WSFG
- 11 Nov 2026: Short 6B 12-26 @ 1.3336 Signals.USAR-MSFG
- 10 Nov 2026: Short 6B 12-26 @ 1.3321 Signals.USAR.TR720
- 10 Nov 2026: Short 6B 12-26 @ 1.3321 Signals.USAR.TR120
Overall Rating
- Short-Term: Bearish,
- Intermediate-Term: Bearish,
- Long-Term: Bearish.
Key Insights Summary
The pound futures swing structure is broadly bearish: the latest large decline completed a reversal from the 1.3504 pivot high and returned price to the active 1.3308 pivot low. Price is below every benchmark average, with the 1.3363 to 1.3424 moving-average cluster defining overhead trend pressure. Weekly, monthly, and yearly Fib-grid readings remain below their respective F0% levels, confirming aligned downside cycle conditions. The pivot sequence remains lower-high/lower-low in character, while 1.3504, 1.3565, and 1.3677 define the principal resistance structure; 1.3140 is the next major lower support reference beneath the current pivot low. Short, intermediate, and long-term signal systems are all aligned to the downside, with elevated daily range behavior reflecting fast downside momentum rather than a stable consolidation.
Chart Analysis ATS AI Generated: 2026-11-11 07:00 for Informational use only, not trading advice. Terms and Risk Disclosure Copyright © 2026. Algo Trading Systems LLC.