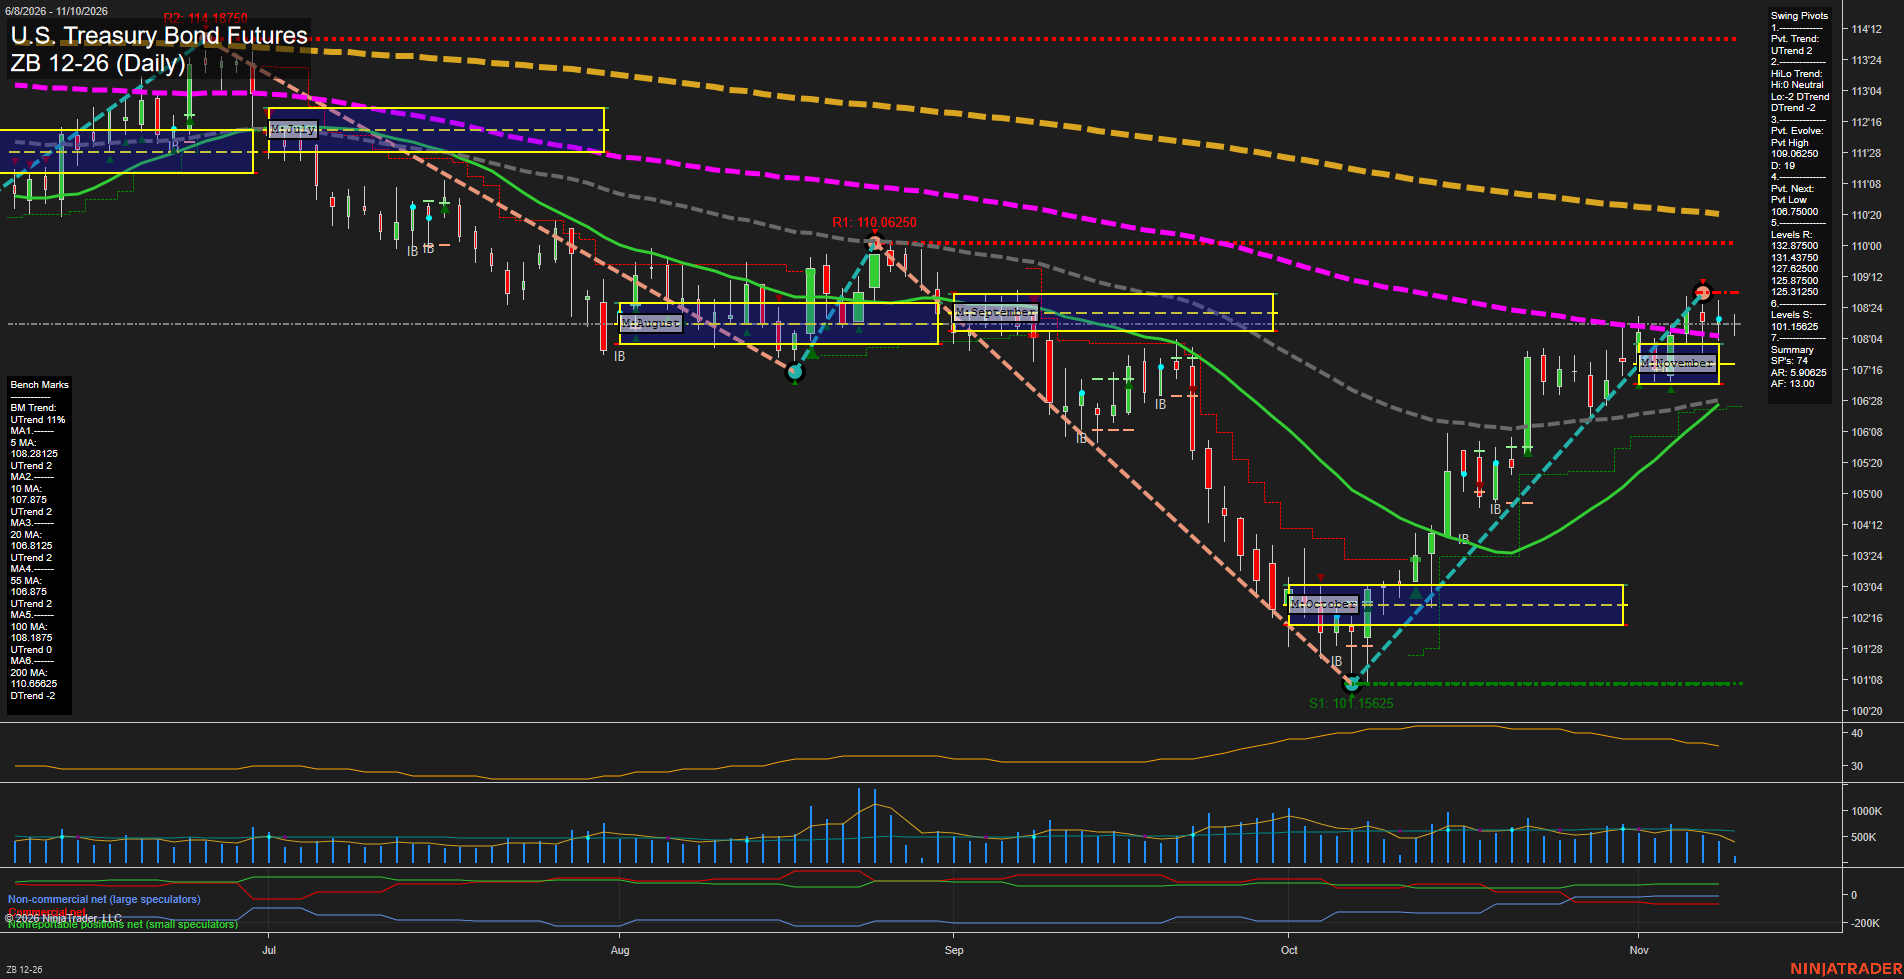
ZB U.S. Treasury Bond Futures Daily Chart Analysis: 2026-Nov-10 07:16 CT
Price Action
- Last: 108.5625,
- Bars: Small,
- Mom: Slow.
WSFG Weekly
- Short-Term
- WSFG Current: 0%
- F0%/NTZ' Bias: Price Neutral,
- WSFG Trend: Neutral.
MSFG Month Nov
- Intermediate-Term
- MSFG Current: 16%
- F0%/NTZ' Bias: Price Above,
- MSFG Trend: Up.
YSFG Year 2026
- Long-Term
- YSFG Current: -28%
- F0%/NTZ' Bias: Price Below,
- YSFG Trend: Down.
Swing Pivots
- (Short-Term) 1. Pvt. Trend: UTrend,
- (Intermediate-Term) 2. HiLo Trend: DTrend,
- 3. Pvt. Evolve: Pvt high 109.06250,
- 4. Pvt. Next: Pvt low 106.75000,
- 5. Levels R: 132.87500, 131.43750, 127.62500, 125.87500, 125.31250,
- 6. Levels S: 101.15625.
Daily Benchmarks
- (Short-Term) 5 Day: 108.28125 Up Trend,
- (Short-Term) 10 Day: 107.87500 Up Trend,
- (Intermediate-Term) 20 Day: 106.81250 Up Trend,
- (Intermediate-Term) 55 Day: 108.87500 Up Trend,
- (Long-Term) 100 Day: 108.18750 Up Trend,
- (Long-Term) 200 Day: 110.56250 Down Trend.
Additional Metrics
Overall Rating
- Short-Term: Bullish,
- Intermediate-Term: Bullish,
- Long-Term: Bearish.
Key Insights Summary
Price has staged a sharp V-recovery from the October 101.15625 pivot low, establishing higher lows and recovering above the 5-day, 10-day, 20-day, and 100-day benchmarks. The short-term pivot structure remains positive, although recent small daily bars beneath the 109.06250 pivot high reflect slowing momentum and consolidation following the rally. Monthly structure remains constructive above the November F0% area, while the yearly grid and declining 200-day benchmark retain a broader bearish backdrop. The chart depicts a countertrend recovery within the longer-term downtrend, with 108.87500 and 109.06250 defining nearby overhead technical pressure.
Chart Analysis ATS AI Generated: 2026-11-10 07:16 for Informational use only, not trading advice. Terms and Risk Disclosure Copyright © 2026. Algo Trading Systems LLC.