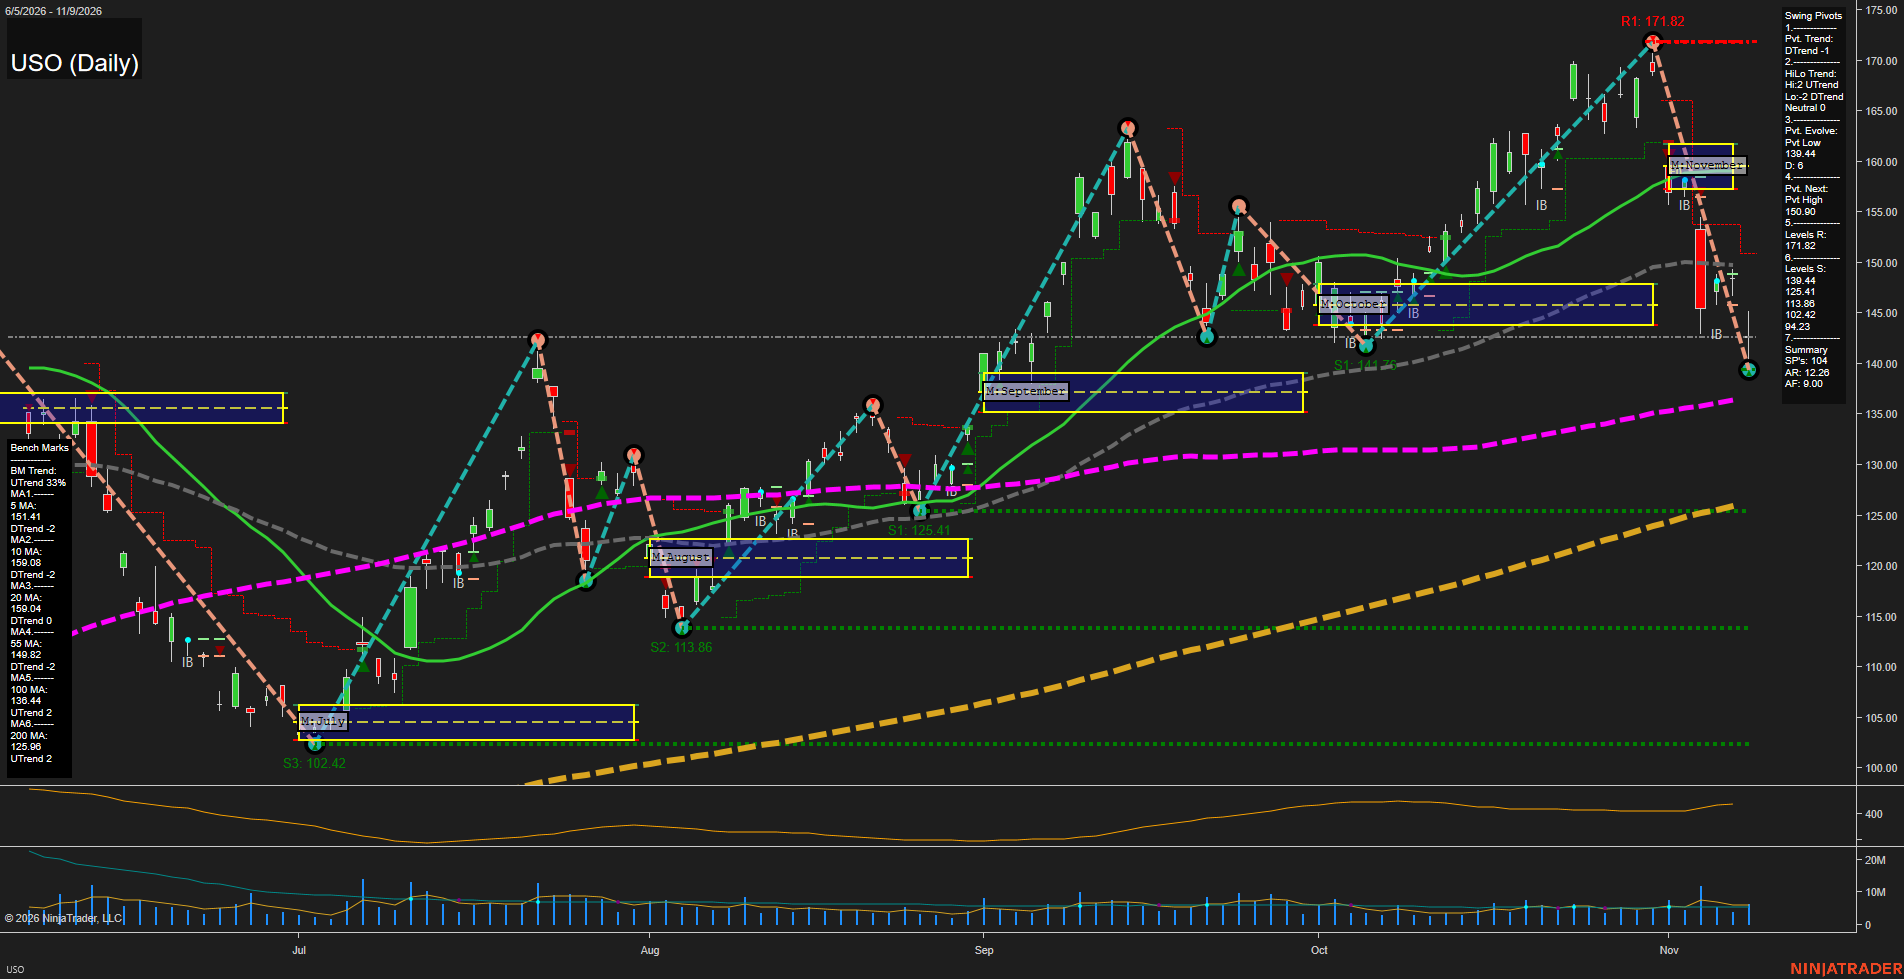
USO United States Oil Fund LP Daily Chart Analysis: 2026-Nov-10 07:15 CT
Price Action
- Last: 149.08,
- Bars: Medium,
- Mom: Fast.
WSFG Weekly
- Short-Term
- WSFG Current: NA%
- F0%/NTZ' Bias: Price Neutral,
- WSFG Trend: Neutral.
MSFG Month Nov
- Intermediate-Term
- MSFG Current: NA%
- F0%/NTZ' Bias: Price Below NTZ,
- MSFG Trend: Bearish.
YSFG Year 2026
- Long-Term
- YSFG Current: NA%
- F0%/NTZ' Bias: Price Neutral,
- YSFG Trend: Neutral.
Swing Pivots
- (Short-Term) 1. Pvt. Trend: DTrend,
- (Intermediate-Term) 2. HiLo Trend: DTrend,
- 3. Pvt. Evolve: Pvt low 139.44,
- 4. Pvt. Next: Pvt high 150.90,
- 5. Levels R: 171.82,
- 6. Levels S: 139.44, 125.41, 113.86, 102.42, 94.23, 74.33.
Daily Benchmarks
- (Short-Term) 5 Day: 151.41 Down Trend,
- (Short-Term) 10 Day: 159.08 Down Trend,
- (Intermediate-Term) 20 Day: 159.04 Down Trend,
- (Intermediate-Term) 55 Day: 149.82 Down Trend,
- (Long-Term) 100 Day: 136.44 Up Trend,
- (Long-Term) 200 Day: 125.96 Up Trend.
Additional Metrics
- ATR: 138,
- VOLMA: 2577640.
Overall Rating
- Short-Term: Bearish,
- Intermediate-Term: Bearish,
- Long-Term: Bullish.
Key Insights Summary
USO is in a fast, high-volatility corrective swing after rejecting from the 171.82 pivot high. The short-term pivot structure is bearish, with price below the 5, 10, 20, and marginally below the 55-day benchmarks. The rebound from 139.44 has produced a sharp countertrend bounce, but 150.90 is the defined pivot-reversal threshold and the clustered 151.41 to 159.08 moving-average zone remains overhead. From a futures swing perspective, the larger structure remains constructive because price is still above rising 100-day and 200-day benchmarks; however, the current daily cycle is a retracement phase within that broader long-term advance.
Chart Analysis ATS AI Generated: 2026-11-10 07:15 for Informational use only, not trading advice. Terms and Risk Disclosure Copyright © 2026. Algo Trading Systems LLC.