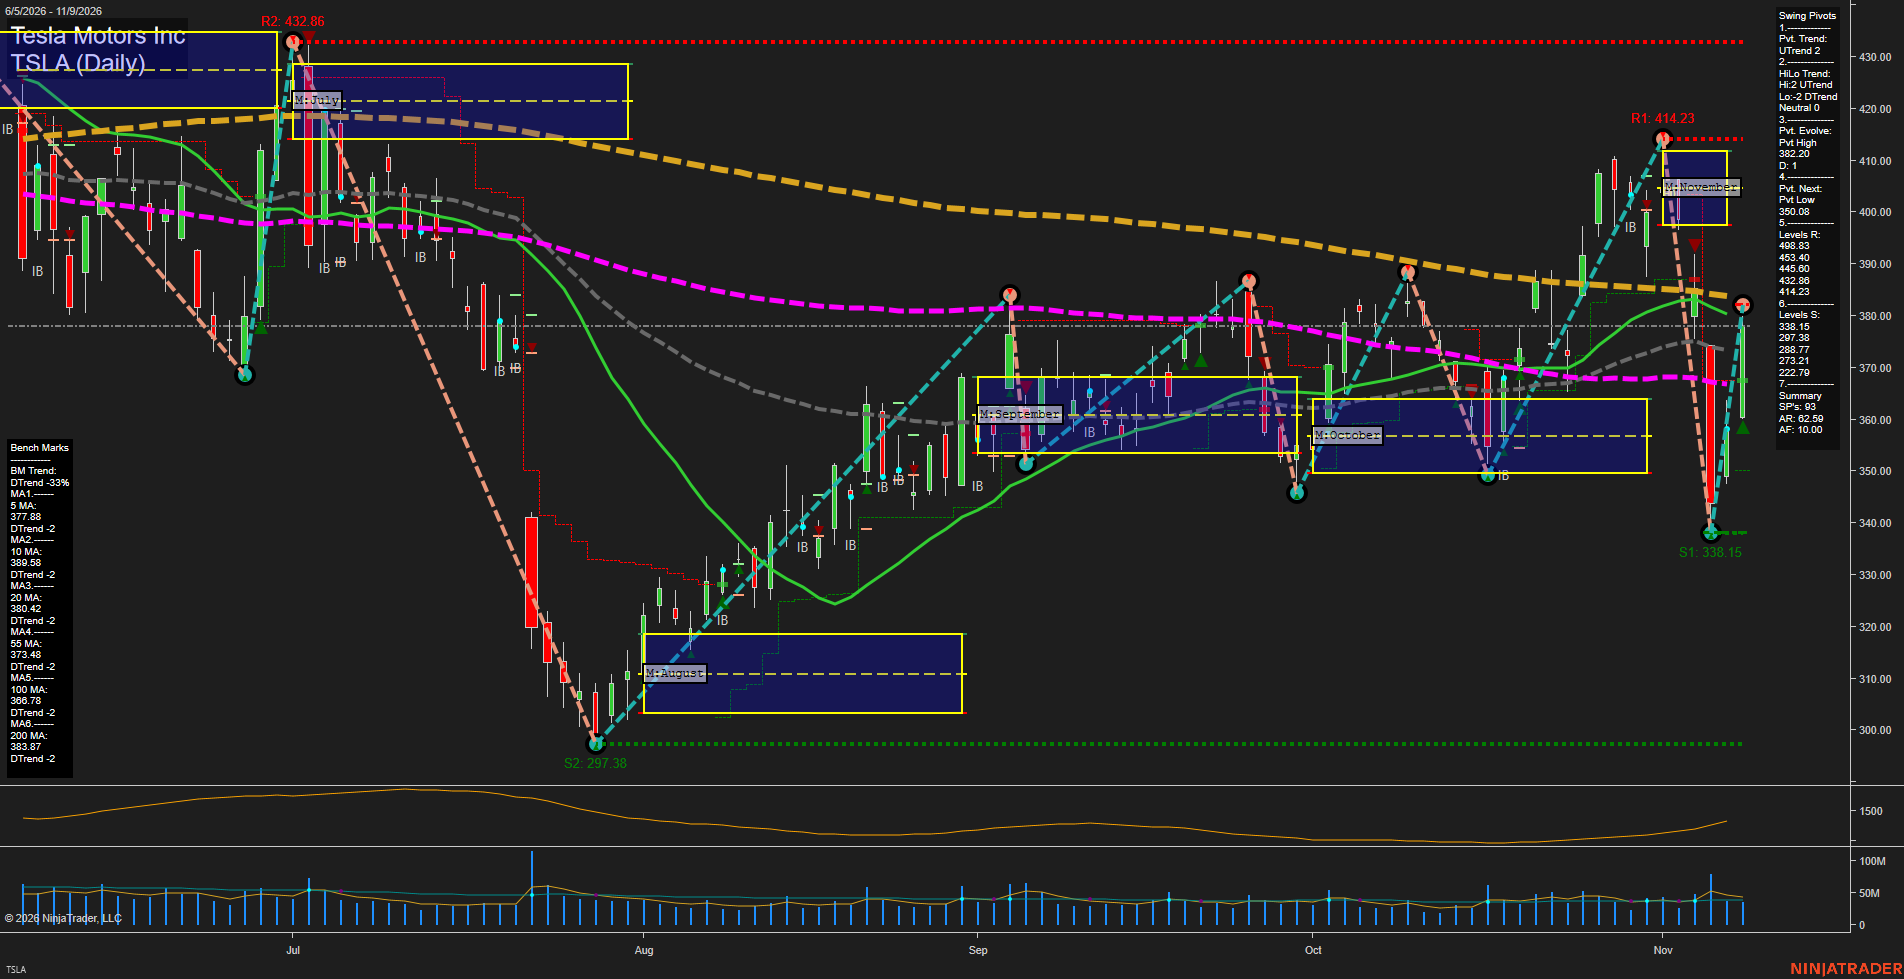
TSLA Tesla Motors Inc Daily Chart Analysis: 2026-Nov-10 07:14 CT
Price Action
- Last: 382.20,
- Bars: Large,
- Mom: Fast.
WSFG Weekly
- Short-Term
- WSFG Current: NA%
- F0%/NTZ' Bias: Price Neutral,
- WSFG Trend: Neutral.
MSFG Month Nov
- Intermediate-Term
- MSFG Current: -4.45%
- F0%/NTZ' Bias: Price Bearish,
- MSFG Trend: DTrend.
YSFG Year 2026
- Long-Term
- YSFG Current: NA%
- F0%/NTZ' Bias: Price Neutral,
- YSFG Trend: Neutral.
Swing Pivots
- (Short-Term) 1. Pvt. Trend: UTrend,
- (Intermediate-Term) 2. HiLo Trend: UTrend,
- 3. Pvt. Evolve: Pvt High 382.20,
- 4. Pvt. Next: Pvt Low 350.08,
- 5. Levels R: 498.33, 453.40, 445.60, 438.20, 414.23,
- 6. Levels S: 338.15, 297.38, 288.77, 273.21, 222.79.
Daily Benchmarks
- (Short-Term) 5 Day: 377.88 Down Trend,
- (Short-Term) 10 Day: 389.58 Down Trend,
- (Intermediate-Term) 20 Day: 380.42 Down Trend,
- (Intermediate-Term) 55 Day: 373.48 Down Trend,
- (Long-Term) 100 Day: 368.78 Down Trend,
- (Long-Term) 200 Day: 383.87 Down Trend.
Additional Metrics
- ATR: 62.59,
- VOLMA: 28000000.
Overall Rating
- Short-Term: Neutral,
- Intermediate-Term: Bearish,
- Long-Term: Bearish.
Key Insights Summary
TSLA futures-style swing structure shows a sharp, high-momentum rebound from the 338.15 pivot support into 382.20, restoring the short-term pivot trend to UTrend. Price remains beneath the 10-day and 200-day benchmarks and below the November MSFG NTZ/F0 area, while all benchmark trend readings remain down. The recovery is therefore a counter-trend bounce within a broader bearish benchmark alignment. The 382.20 pivot high and 383.87 200-day average form an immediate overhead decision area, followed by 414.23 resistance. A retracement beneath the 373.48 to 380.42 intermediate benchmark cluster would shift focus back toward the 350.08 pivot-next level and the major 338.15 support. Signals remain mixed short term, while the WSFG, MSFG, and longer-duration trend themes retain a bearish-to-neutral bias.
Chart Analysis ATS AI Generated: 2026-11-10 07:14 for Informational use only, not trading advice. Terms and Risk Disclosure Copyright © 2026. Algo Trading Systems LLC.