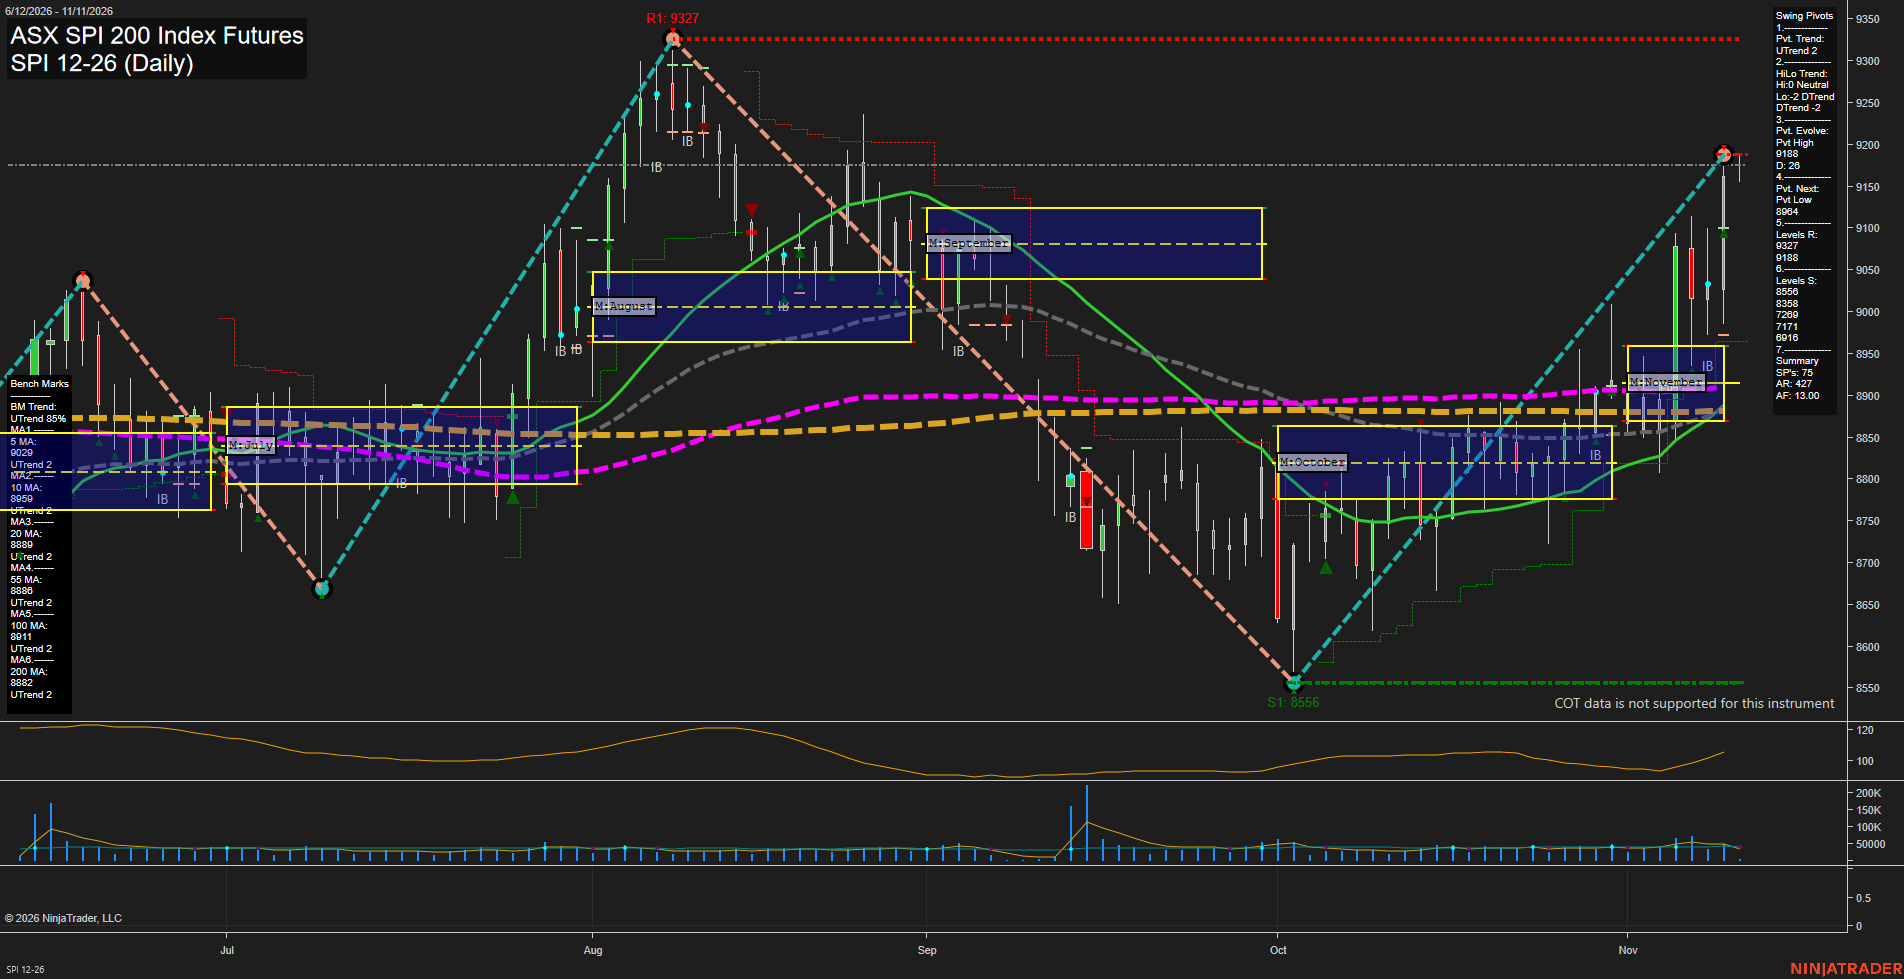
SPI ASX SPI 200 Index Futures Daily Chart Analysis: 2026-Nov-10 07:13 CT
Price Action
- Last: 9188,
- Bars: Large,
- Mom: fast.
WSFG Weekly
- Short-Term
- WSFG Current: NA%
- F0%/NTZ' Bias: Price Neutral,
- WSFG Trend: Neutral.
MSFG Month Nov
- Intermediate-Term
- MSFG Current: NA%
- F0%/NTZ' Bias: Price Above NTZ,
- MSFG Trend: Bullish.
YSFG Year 2026
- Long-Term
- YSFG Current: NA%
- F0%/NTZ' Bias: Price Neutral,
- YSFG Trend: Neutral.
Swing Pivots
- (Short-Term) 1. Pvt. Trend: UTrend,
- (Intermediate-Term) 2. HiLo Trend: DTrend,
- 3. Pvt. Evolve: Pvt high 9188,
- 4. Pvt. Next: Pvt low 8984,
- 5. Levels R: 9327, 9188,
- 6. Levels S: 8556, 8338, 7269, 7171, 6916.
Daily Benchmarks
- (Short-Term) 5 Day: 9029 Up Trend,
- (Short-Term) 10 Day: 8959 Up Trend,
- (Intermediate-Term) 20 Day: 8889 Up Trend,
- (Intermediate-Term) 55 Day: 8886 Up Trend,
- (Long-Term) 100 Day: 8911 Up Trend,
- (Long-Term) 200 Day: 8882 Up Trend.
Additional Metrics
Overall Rating
- Short-Term: Bullish,
- Intermediate-Term: Bullish,
- Long-Term: Bullish.
Key Insights Summary
SPI futures completed a sharp V-shaped recovery from the October 8556 swing low and accelerated through the clustered 20-, 55-, 100-, and 200-day benchmarks near 8882-8911. Short-term pivot structure is rising, momentum is fast, and price is above the November monthly grid, while the intermediate HiLo pivot structure remains lagging after the prior decline. The market is testing the 9188 pivot-high area; a sustained extension would focus attention on the 9327 higher resistance pivot, whereas 8984 is the defined opposite-pivot reversal level. The recent rally has expanded daily ranges and lifted ATR, indicating an energetic recovery phase rather than a quiet consolidation.
Chart Analysis ATS AI Generated: 2026-11-10 07:13 for Informational use only, not trading advice. Terms and Risk Disclosure Copyright © 2026. Algo Trading Systems LLC.