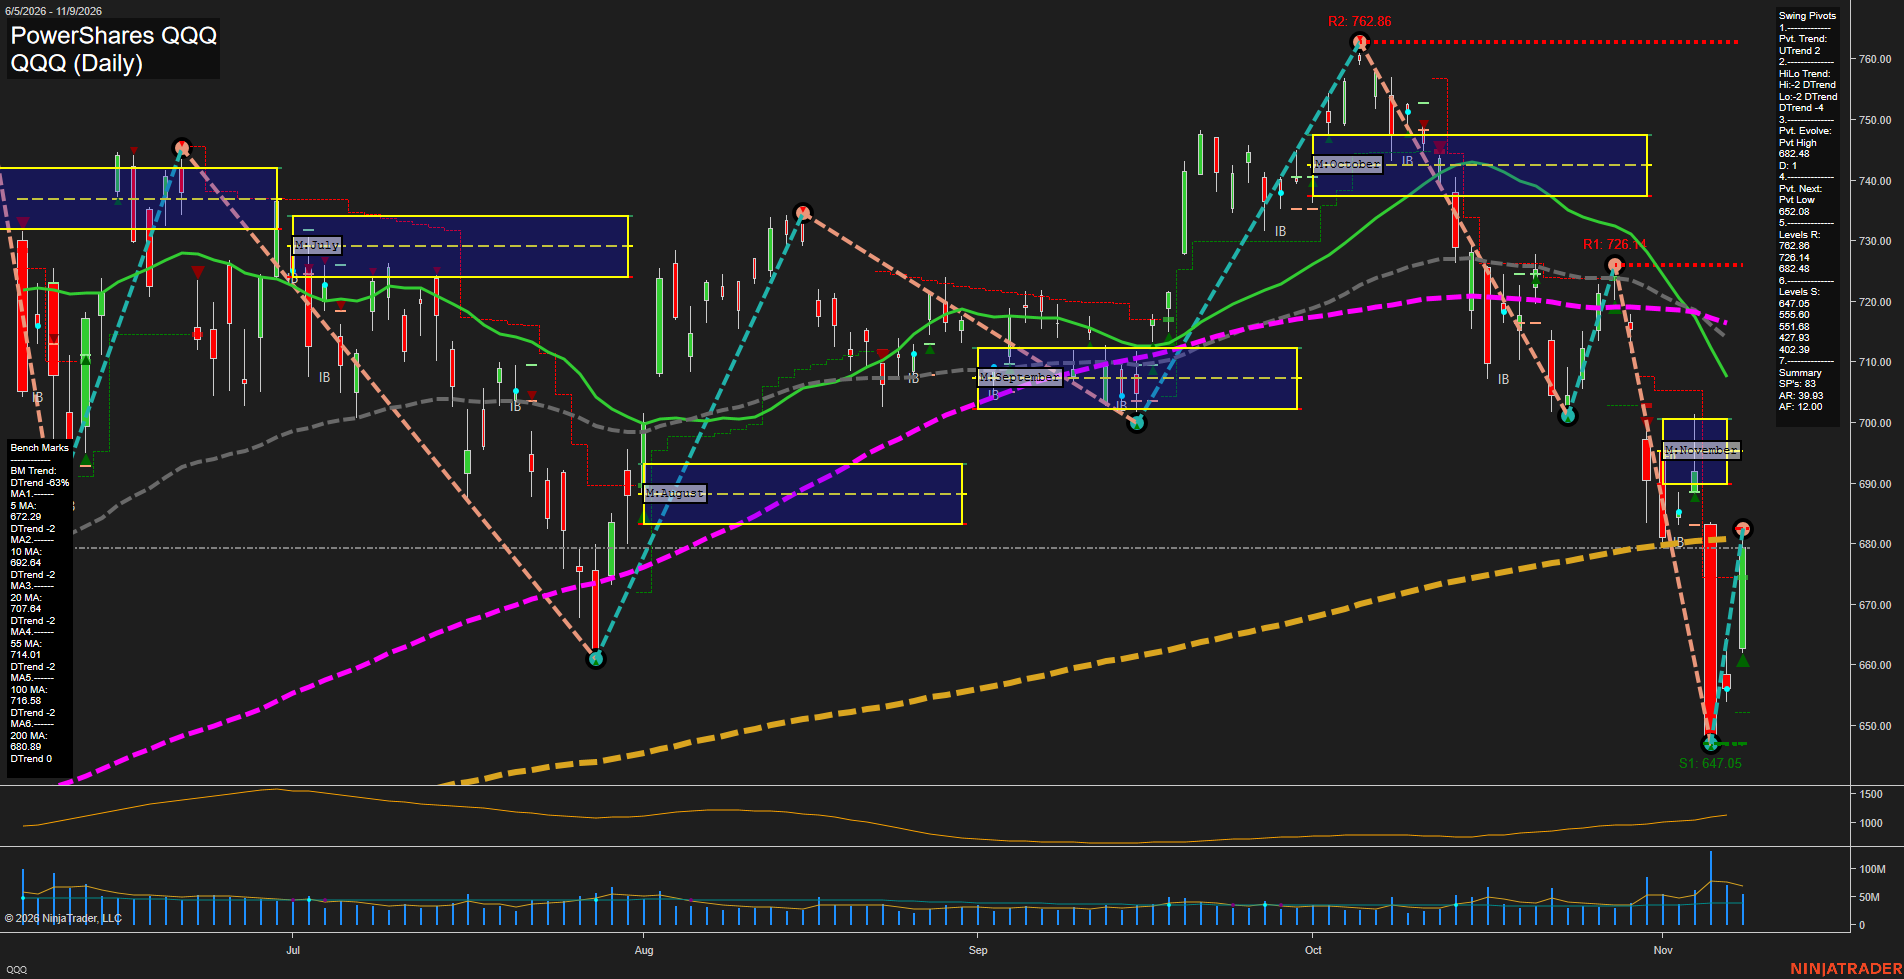
QQQ PowerShares QQQ Daily Chart Analysis: 2026-Nov-10 07:11 CT
Price Action
- Last: 682.48,
- Bars: Large,
- Mom: fast.
WSFG Weekly
- Short-Term
- WSFG Current: NA%
- F0%/NTZ' Bias: Price Neutral,
- WSFG Trend: Neutral.
MSFG Month Nov
- Intermediate-Term
- MSFG Current: NA%
- F0%/NTZ' Bias: Price Bearish,
- MSFG Trend: Bearish.
YSFG Year 2026
- Long-Term
- YSFG Current: NA%
- F0%/NTZ' Bias: Price Neutral,
- YSFG Trend: Neutral.
Swing Pivots
- (Short-Term) 1. Pvt. Trend: UTrend,
- (Intermediate-Term) 2. HiLo Trend: DTrend,
- 3. Pvt. Evolve: Pvt High 682.48,
- 4. Pvt. Next: Pvt Low 652.08,
- 5. Levels R: 762.86, 726.14, 682.48,
- 6. Levels S: 647.05, 595.60, 551.68, 427.93, 400.29.
Daily Benchmarks
- (Short-Term) 5 Day: 672.29 Down Trend,
- (Short-Term) 10 Day: 692.84 Down Trend,
- (Intermediate-Term) 20 Day: 707.84 Down Trend,
- (Intermediate-Term) 55 Day: 714.01 Down Trend,
- (Long-Term) 100 Day: 716.58 Down Trend,
- (Long-Term) 200 Day: 680.89 Up Trend.
Additional Metrics
- ATR: 39.03,
- VOLMA: 40000000.
Overall Rating
- Short-Term: Bearish,
- Intermediate-Term: Bearish,
- Long-Term: Neutral.
Key Insights Summary
QQQ is exhibiting a high-volatility futures-style swing environment following a sharp washout into the 647.05 pivot-support area and a fast rebound toward 682.48. The short-term pivot designation has turned upward, but the broader HiLo structure remains in a downtrend, characterizing the bounce as a countertrend recovery within an intermediate bearish sequence of lower highs. Price remains below the declining 10-, 20-, 55-, and 100-day benchmarks, while the 200-day average near 680.89 is acting as the principal long-term balance reference. The 682.48 pivot is the immediate overhead decision level, with 726.14 the next major resistance; 647.05 remains the defining downside swing support. Elevated ATR and expanded volume reflect a repricing phase with wide daily ranges, rapid retracements, and unstable directional control.
Chart Analysis ATS AI Generated: 2026-11-10 07:11 for Informational use only, not trading advice. Terms and Risk Disclosure Copyright © 2026. Algo Trading Systems LLC.