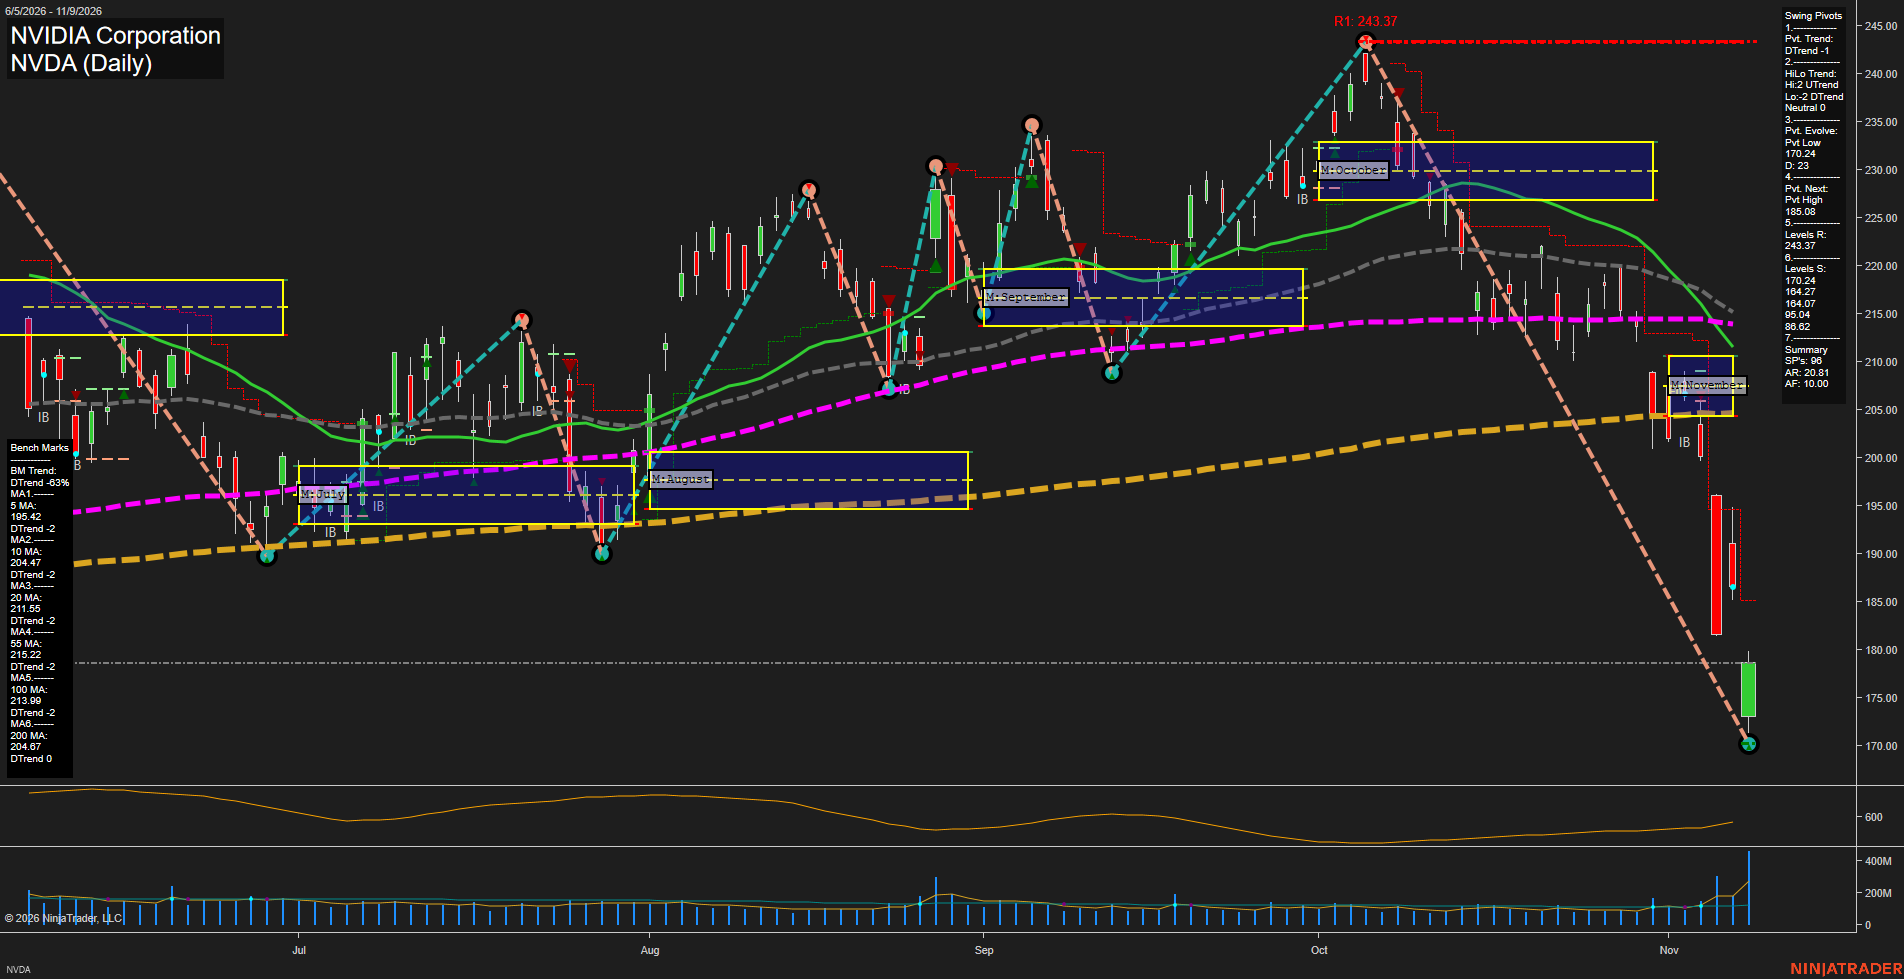
NVDA NVIDIA Corporation Daily Chart Analysis: 2026-Nov-10 07:11 CT
Price Action
- Last: 178.00,
- Bars: Large,
- Mom: fast.
WSFG Weekly
- Short-Term
- WSFG Current: NA%
- F0%/NTZ' Bias: Price Neutral,
- WSFG Trend: Neutral.
MSFG Month Nov
- Intermediate-Term
- MSFG Current: NA%
- F0%/NTZ' Bias: Price Neutral,
- MSFG Trend: Neutral.
YSFG Year 2026
- Long-Term
- YSFG Current: NA%
- F0%/NTZ' Bias: Price Neutral,
- YSFG Trend: Neutral.
Swing Pivots
- (Short-Term) 1. Pvt. Trend: DTrend,
- (Intermediate-Term) 2. HiLo Trend: UTrend,
- 3. Pvt. Evolve: Pvt low 170.24,
- 4. Pvt. Next: Pvt high 185.08,
- 5. Levels R: 243.37,
- 6. Levels S: 170.24, 164.27, 164.07, 95.04, 86.62, 77.00.
Daily Benchmarks
- (Short-Term) 5 Day: 195.42 Down Trend,
- (Short-Term) 10 Day: 204.47 Down Trend,
- (Intermediate-Term) 20 Day: 211.59 Down Trend,
- (Intermediate-Term) 55 Day: 215.22 Down Trend,
- (Long-Term) 100 Day: 213.99 Down Trend,
- (Long-Term) 200 Day: 204.67 Down Trend.
Additional Metrics
- ATR: 10.00,
- VOLMA: 346637249.
Overall Rating
- Short-Term: Bearish,
- Intermediate-Term: Bearish,
- Long-Term: Bearish.
Key Insights Summary
NVDA futures-equivalent price action is in a high-volatility liquidation phase, marked by large-range bars, accelerating downside momentum, and a break beneath every displayed daily benchmark. The short-term pivot structure remains in DTrend, with 170.24 defining the active pivot low and 185.08 the next opposing pivot threshold. The intermediate HiLo structure remains UTrend, but it is under substantial countertrend pressure after the sharp rejection from the 243.37 swing-high resistance area. The recovery bar from 170.24 shows a reflexive bounce following an outsized selloff, while elevated volume and ATR behavior reflect an expanded price-discovery environment rather than orderly consolidation.
Chart Analysis ATS AI Generated: 2026-11-10 07:11 for Informational use only, not trading advice. Terms and Risk Disclosure Copyright © 2026. Algo Trading Systems LLC.