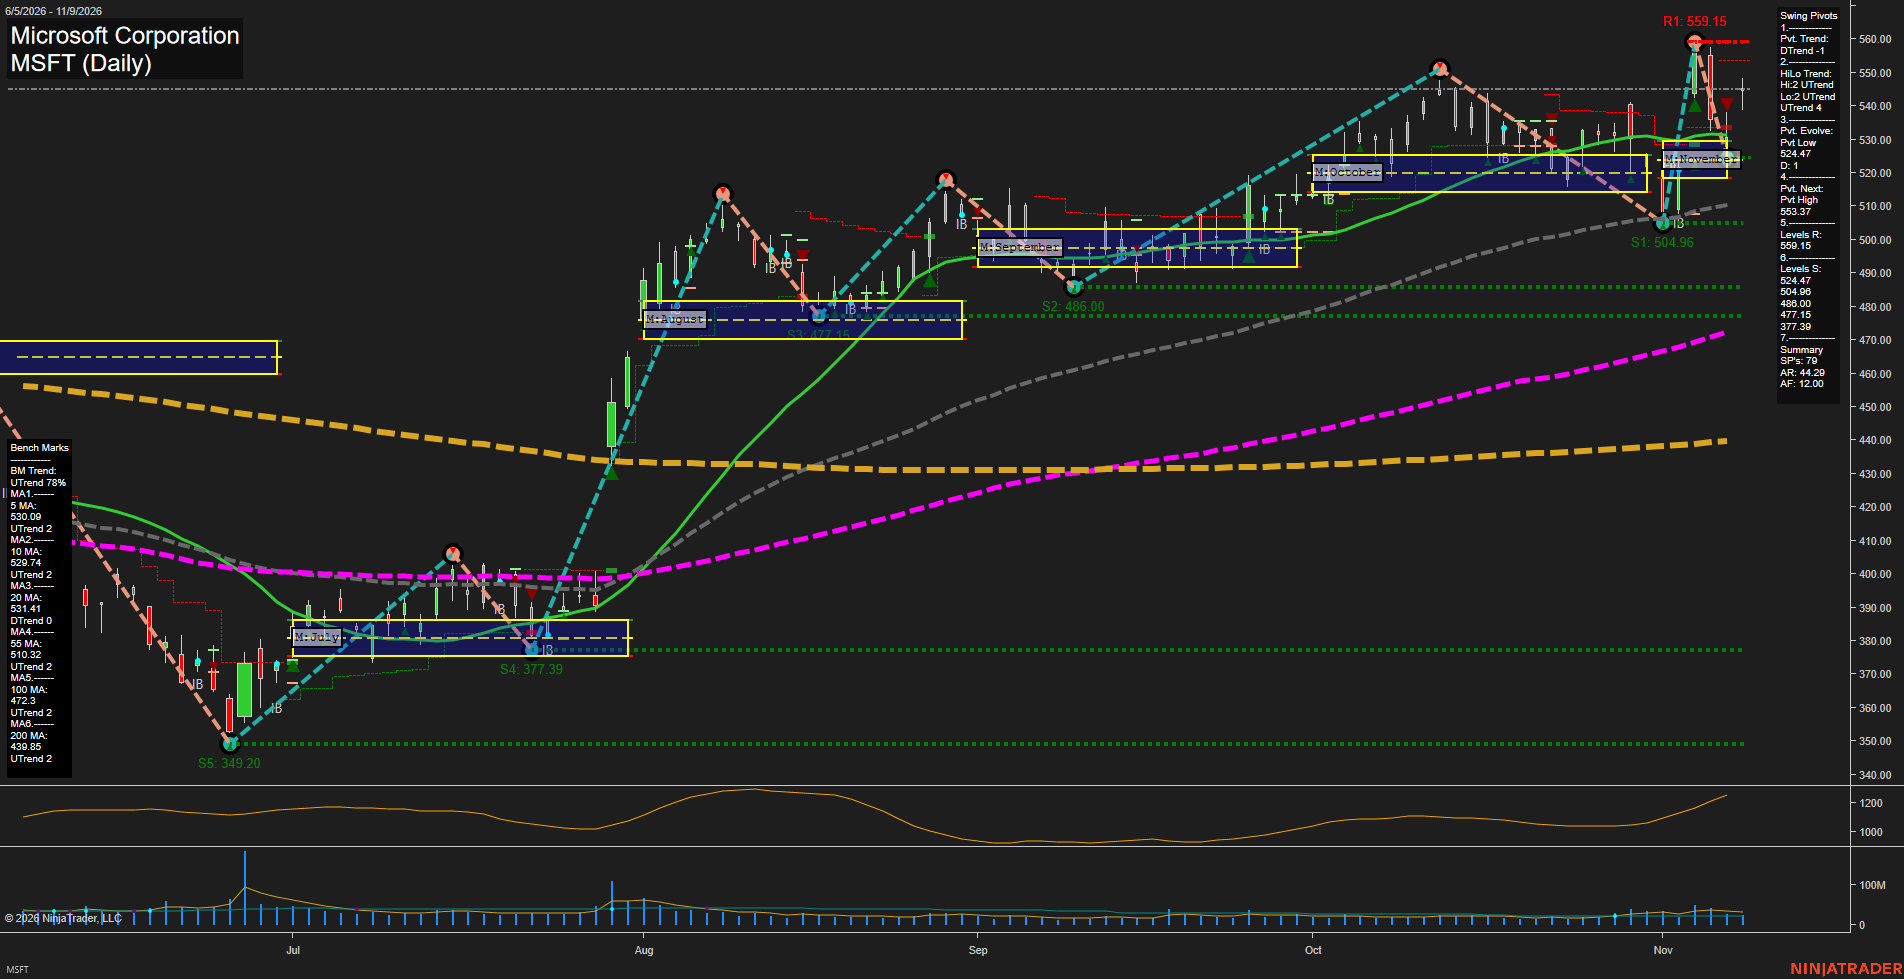
MSFT Microsoft Corporation Daily Chart Analysis: 2026-Nov-10 07:09 CT
Price Action
- Last: 524.47,
- Bars: Large,
- Mom: fast.
WSFG Weekly
- Short-Term
- WSFG Current: NA%
- F0%/NTZ' Bias: Price Neutral,
- WSFG Trend: Neutral.
MSFG Month Nov
- Intermediate-Term
- MSFG Current: NA%
- F0%/NTZ' Bias: Price Neutral,
- MSFG Trend: Neutral.
YSFG Year 2026
- Long-Term
- YSFG Current: NA%
- F0%/NTZ' Bias: Price Neutral,
- YSFG Trend: Neutral.
Swing Pivots
- (Short-Term) 1. Pvt. Trend: DTrend,
- (Intermediate-Term) 2. HiLo Trend: UTrend,
- 3. Pvt. Evolve: Pvt low 524.47,
- 4. Pvt. Next: Pvt high 553.37,
- 5. Levels R: 559.15,
- 6. Levels S: 524.47, 504.96, 486.00, 477.15, 377.39, 349.20.
Daily Benchmarks
- (Short-Term) 5 Day: 530.09 Up Trend,
- (Short-Term) 10 Day: 529.74 Up Trend,
- (Intermediate-Term) 20 Day: 531.41 Down Trend,
- (Intermediate-Term) 55 Day: 510.32 Up Trend,
- (Long-Term) 100 Day: 472.32 Up Trend,
- (Long-Term) 200 Day: 439.85 Up Trend.
Additional Metrics
- ATR: 12.00,
- VOLMA: 26357793.
Overall Rating
- Short-Term: Bearish,
- Intermediate-Term: Bullish,
- Long-Term: Bullish.
Key Insights Summary
MSFT is in a short-term corrective downswing after rejection from the 559.15 pivot-high resistance area. Price is below the 5-, 10-, and 20-day benchmarks and has evolved into a 524.47 pivot low, reflecting fast downside momentum and expanded daily range behavior. The broader swing structure remains constructive because the intermediate HiLo trend is upward and price remains above the rising 55-, 100-, and 200-day benchmarks. From a futures swing perspective, the chart shows a counter-trend retracement within a larger upward structure, with 524.47 as the immediate structural reference, 504.96 as the next lower support zone, and 553.37 to 559.15 defining the overhead pivot and resistance region.
Chart Analysis ATS AI Generated: 2026-11-10 07:09 for Informational use only, not trading advice. Terms and Risk Disclosure Copyright © 2026. Algo Trading Systems LLC.